


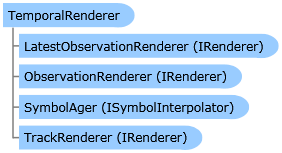
 Object Model
Syntax
| Visual Basic (Declaration) | |
|---|---|
Public Class TemporalRenderer Inherits System.Windows.DependencyObject Implements ILegendSupport, IRenderer, ITemporalRenderer | |
| C# | |
|---|---|
public class TemporalRenderer : System.Windows.DependencyObject, ILegendSupport, IRenderer, ITemporalRenderer | |
Example
| XAML |  Copy Code Copy Code |
|---|---|
<Grid x:Name="LayoutRoot" Background="White"> <!-- Display the FeatureLayer in Map3 that has a TemporalRenderer applied: Add an ArcGISTiledMapsServiceLayer as a background to the map. The ArcGISTiledMapsServiceLayer layer is first Layer added to the Map's Layers Collection and is drawn on the bottom. A FeatureLayer is then added to the Map and draws on top of the background layer. Set the Map3 Extent to zoom to the middle of the Atlantic ocean. Setting the Map's TimeExtent acts like a Where clause in that only those features/records that fall within the set TimeExtent will then be shown. If no Map TimeExtent is set then only the ObservationRenderer is in effect. If a Map TimeExtent is set then the ObservationRenderer and the TrackRenderer are in effect. In the case of this example the TimeExtent for the hurricane information is shortened to a small temporal window that just covers the time extent necessary to render the four hurricanes (Alberto, Isaac, Michael, and Nadine) that are returned by the service. By binding the Map3 TimeExtent to the TimeSlider3 Value, the Map3 will automatically update as the slider moves. --> <esri:Map Background="White" Height="375" HorizontalAlignment="Left" Margin="408,227,0,0" Name="Map3" VerticalAlignment="Top" Width="375" Extent="-82.08,2.81,-16.17,68.73" TimeExtent="{Binding ElementName=TimeSlider3, Path=Value}"> <!-- Add an ArcGISTiledMapsServiceLayer as a background to the map. Note: The first Layer added to the Map's Layers Collection is on the bottom and the other Layer is added on the top. --> <esri:ArcGISTiledMapServiceLayer ID="StreetMapLayer" Url="http://services.arcgisonline.com/ArcGIS/rest/services/ESRI_StreetMap_World_2D/MapServer"/> <!-- The FeatureLayer contains Hurricane data from NOAA as Markers (aka. Points). The Where clause is optional. It is necessary when more that 500/1000 records returned. In ArcGIS Server 9.3.1 and prior, the default maximum is 500 records returned per FeatureLayer. In ArcGIS Server 10 the default is 1000. This setting is configurable per map service using ArcCatalog or ArcGIS Server Manager (on the Parameters tab). The Where clases gets only hurricane data for Alberto. Specify the Outfields Property to specify which Fields are returned on which the TemporalRenderer TrackIdField can use. Specifying the wildcard (*) character will return all Fields. --> <esri:FeatureLayer ID="MyFeatureLayer" Url="http://servicesbeta.esri.com/ArcGIS/rest/services/Hurricanes/Hurricanes/MapServer/0" Where="EVENTID = 'Alberto'" OutFields="*"> <esri:FeatureLayer.Renderer> <!-- Create the TemporalRenderer object. Setting the TrackIdField draws polylines in time order for a group of attributes. If the TrackIdField property is not set and the TrackRenderer is used, then all point observations will have a polyline connecting them in order of time. This becomes messy if multiple events are occurring at the same time (i.e. hurricanes) and the linework would then look like a spider diagram rather than discreet tracks with one per event. In this example to speed up drawing time and limit the amount of data that is returned, the FeatureLayer.Where clause was used to restrict only one hurricane (or event) from displaying. If the FeatureLayer.Where clause was commented out, multiple hurricanes would be displayed. Having the TrackIdField becomes key to keeping each event separate. The FeatureLayer OutFields Property is set to return all the fields via the wildcard character (*) and hence we can specify "EVENTID". --> <esri:TemporalRenderer TrackIdField="EVENTID"> <!-- Setting the ObservationRenderer. In this example, a ClassBreaksBrenderer will be used to make a solid black circle symbol become larger as the size of hurricane Alberto grows via it's wind speed. Create the ClassBreaksRenderer and set the Field value for which groups will be defined. The FeatureLayer OutFields Property is set to return all the fields via the wildcard character (*) and hence we can specify "WINDSPEED". Define the Default symbol and ClassBreakInfo objects for: Tropical Depression, Tropical Storm, Hurricane Categories I, II and III. --> <esri:TemporalRenderer.ObservationRenderer> <esri:ClassBreaksRenderer Field="WINDSPEED"> <esri:ClassBreaksRenderer.DefaultSymbol> <esri:SimpleMarkerSymbol Color="Black" Size="1"/> </esri:ClassBreaksRenderer.DefaultSymbol> <esri:ClassBreakInfo MinimumValue="0" MaximumValue="39" Label="0 to 38 MPH" Description="Tropical Depression"> <esri:SimpleMarkerSymbol Color="Black" Size="5"/> </esri:ClassBreakInfo> <esri:ClassBreakInfo MinimumValue="39" MaximumValue="74" Label="39 to 73 MPH" Description="Tropical Storm"> <esri:SimpleMarkerSymbol Color="Black" Size="8"/> </esri:ClassBreakInfo> <esri:ClassBreakInfo MinimumValue="74" MaximumValue="96" Label="74 to 95 MPH" Description="Hurricane Category I"> <esri:SimpleMarkerSymbol Color="Black" Size="11"/> </esri:ClassBreakInfo> <esri:ClassBreakInfo MinimumValue="96" MaximumValue="111" Label="96 to 110 MPH" Description="Hurricane Category II"> <esri:SimpleMarkerSymbol Color="Black" Size="13"/> </esri:ClassBreakInfo> <esri:ClassBreakInfo MinimumValue="111" MaximumValue="131" Label="111 to 139 MPH" Description="Hurricane Category III"> <esri:SimpleMarkerSymbol Color="Black" Size="15"/> </esri:ClassBreakInfo> </esri:ClassBreaksRenderer> </esri:TemporalRenderer.ObservationRenderer> <!-- LastObservationRenderer: If you do not want the last observation point in the returned set of features to be rendered differently, then do not use the LatestObservationRenderer. If no Map3 TimeExtent is set then the LastObservationRenderer will not be drawn. Define a SimpleRenderer with a SimpleMarkerSymbol to display each observation. The last observation will be a red diamond. --> <esri:TemporalRenderer.LatestObservationRenderer> <esri:SimpleRenderer> <esri:SimpleMarkerSymbol Color="Red" Size="10" Style="Diamond"/> </esri:SimpleRenderer> </esri:TemporalRenderer.LatestObservationRenderer> <!-- TrackRenderer: Define a SimpleRenderer with a SimpleLineSymbol to display each tracked event. The event will be a yellow line connecting the time-based observations. --> <esri:TemporalRenderer.TrackRenderer> <esri:SimpleRenderer> <esri:SimpleLineSymbol Color="Yellow" Width="2"/> </esri:SimpleRenderer> </esri:TemporalRenderer.TrackRenderer> <!-- SymbolAger: The SymbolAger will override the default rendering provided by the ObservationRenderer as the TimeExtentProperty for the Map changes. The goal is to provide rendering to show how a phenomena has changed over time. Use a RampInterpolator as the SymbolAger. The RampInterpolator will provide an interpolation of up to three attributes for a symbol (Color, Opacity, and Size) between the TimeExtentProperty specified. You specify the From and To values for the desired attributes and the interpolation occurs automatically between them based upon the TimeExtent. In this example only the Opacity attribute of the RampInterpolator is being use to show that as hurricane Alberto ages (i.e. gets older) the visibility of the symbol at its historical spatial location begins to fade. Uncomment the other RampInterpolator attributes (Color and Size) to see how they impact the visualization. Note: by ramping the Size of the of the symbol of the using a RampInterpolator overrides the effect of the ClassBreaksRenderer where the hurricanes "WINDSPEED" was used to define the size. --> <esri:TemporalRenderer.SymbolAger> <esri:RampInterpolator> <esri:RampInterpolator.OpacityRange> <esri:OpacityRange From="1" To="0.2"/> </esri:RampInterpolator.OpacityRange> <!-- <esri:RampInterpolator.ColorRange> <esri:ColorRange From="Green" To="Red"/> </esri:RampInterpolator.ColorRange> <esri:RampInterpolator.SizeRange> <esri:SizeRange From="30" To="5"/> </esri:RampInterpolator.SizeRange> --> </esri:RampInterpolator> </esri:TemporalRenderer.SymbolAger> </esri:TemporalRenderer> </esri:FeatureLayer.Renderer> </esri:FeatureLayer> </esri:Map> <!-- Set the MinimumValue and MaximumValue of the TimeSlider3 to match the temporal window of hurricane Alberto. Setting the Value defines where the slider handle will be on the TimeSlider control. In this case at the beginning of the hurricane Alberto (all the way to the left side). --> <esri:TimeSlider Name="TimeSlider3" MinimumValue="2000/08/04 00:00:01 UTC" MaximumValue="2000/08/24 06:00:01 UTC" Value="2000/08/04 00:00:01 UTC,2000/08/04 00:00:01 UTC" HorizontalAlignment="Left" VerticalAlignment="Top" Height="25" Width="375" Margin="408,201,0,0"> </esri:TimeSlider> <!-- Bind the Value.Start (which is a Date) from TimeSlider3 to the TextBlock_StartTime.TextProperty. The text will remain static since the slider handle is already set to the beginning. --> <TextBlock Name="TextBlock_StartTime" Text="{Binding ElementName=TimeSlider3, Path=Value.Start}" HorizontalAlignment="Left" VerticalAlignment="Top" Height="23" Margin="413,177,0,0" /> <!-- Bind the Value.End (which is a Date) from TimeSlider3 to the TextBlock_EndTime.TextProperty. This will update the text automatically as the slider moves to the right and the EndTime changes. --> <TextBlock Name="TextBlock_EndTime" Text="{Binding ElementName=TimeSlider3, Path=Value.End}" HorizontalAlignment="Left" VerticalAlignment="Top" Height="23" Margin="655,177,0,0" /> </Grid> | |
| C# | Copy Code |
|---|---|
void MainPage_Loaded(object sender, RoutedEventArgs e) { // Initialize the controls upon application startup. // In this example it is assumed that the following controls were previously added in XAML: // Map3 <== ESRI.ArcGIS.Client.Map Control // TimeSlider3 <== ESRI.ArcGIS.Client.Toolkit.TimeSlider Control // TextBlock_StartTime <== System.Windows.Controls.TextBlock // TextBlock_EndTime <== System.Windows.Controls.TextBlock // Add an ArcGISTiledMapsServiceLayer as a background to the map. Note: The first Layer added to the Map's // Layers Collection is on the bottom and the other Layer is added on the top. ESRI.ArcGIS.Client.ArcGISTiledMapServiceLayer myArcGISTiledMapServiceLayer1 = new ESRI.ArcGIS.Client.ArcGISTiledMapServiceLayer(); myArcGISTiledMapServiceLayer1.Url = "http://services.arcgisonline.com/ArcGIS/rest/services/ESRI_StreetMap_World_2D/MapServer"; Map3.Layers.Add(myArcGISTiledMapServiceLayer1); // Add a FeatureLayer to the map. Note: This Layer is drawn on top of the background layer. ESRI.ArcGIS.Client.FeatureLayer myFeatureLayer3 = new ESRI.ArcGIS.Client.FeatureLayer(); myFeatureLayer3.ID = "hurricane"; // A FeatureLayer that is Time enabled and contains hurricane data from NOAA. myFeatureLayer3.Url = "http://servicesbeta.esri.com/ArcGIS/rest/services/Hurricanes/Hurricanes/MapServer/0"; // The Where clause is optional. It is necessary when more that 500/1000 records returned. In ArcGIS Server // 9.3.1 and prior, the default maximum is 500 records returned per FeatureLayer. In ArcGIS Server 10 the // default is 1000. This setting is configurable per map service using ArcCatalog or ArcGIS Server Manager // (on the Parameters tab). myFeatureLayer3.Where = "EVENTID = 'Alberto'"; //Only display hurricane data for Alberto. // Specify the Outfields Property to specify which Fields are returned on which the TemporalRenderer.TrackIdField // and the Client.ClassBreaksRenderer can use. Specifying the wildcard (*) character in the Add Property will // return all Fields. myFeatureLayer3.OutFields.Add("*"); // Add the myFeatureLayer3 to the Map3 Layers Collection. Map3.Layers.Add(myFeatureLayer3); // Zoom to the middle of the Atlantic Ocean. ESRI.ArcGIS.Client.Geometry.Envelope myEnvelope3 = new ESRI.ArcGIS.Client.Geometry.Envelope(); myEnvelope3.XMin = -82.08; myEnvelope3.YMin = 2.81; myEnvelope3.XMax = -16.17; myEnvelope3.YMax = 68.73; Map3.Extent = myEnvelope3; // Setting the Map's TimeExtent acts like a Where clause in that only those features/records that fall // within the set TimeExtent will then be shown. If no Map.TimeExtent is set then only the // ObservationRenderer is in effect. If a Map.TimeExtent is set then the ObservationRenderer and the // LastObservationRenderer and TrackRenderer are in effect. In the case of this example // the TimeExtent for the hurricane Alberto is shortened to a small temporal window to display the // various rendering effects clearly. ESRI.ArcGIS.Client.TimeExtent myTimeExtent = new ESRI.ArcGIS.Client.TimeExtent(); System.DateTime dateStart = DateTime.Parse("8/4/2000 12:00:01 AM"); //Alberto Start myTimeExtent.Start = dateStart; System.DateTime dateEnd = DateTime.Parse("8/24/2000 6:00:01 AM"); //Alberto End myTimeExtent.End = dateEnd; // Set the minimum and maximum values of the TimeSlider3. TimeSlider3.MinimumValue = myTimeExtent.Start; TimeSlider3.MaximumValue = myTimeExtent.End; // Create another TimeExtent with the beginning and ending date being the same. This will set where the // slider is along the TimeSlider control. In our case we want it at the beginning. ESRI.ArcGIS.Client.TimeExtent myTimeExtentX = new ESRI.ArcGIS.Client.TimeExtent(); System.DateTime dateStartX = DateTime.Parse("8/4/2000 12:00:01 AM"); //Alberto Start! myTimeExtentX.Start = dateStartX; System.DateTime dateEndX = DateTime.Parse("8/4/2000 12:00:01 AM"); //Alberto Start! myTimeExtentX.End = dateEndX; TimeSlider3.Value = myTimeExtentX; // Define the text above the TimeSlider that tells what is the start date/time. TextBlock_StartTime.Text = dateStart.ToString(); // Bind the Value.End (which is a Date) from TimeSlider3 to the TextBlock_EndTime.TextProperty. This // will update the text automatically as the slider moves. System.Windows.Data.Binding myBinding = new System.Windows.Data.Binding("Value.End"); myBinding.Mode = System.Windows.Data.BindingMode.OneWay; myBinding.ElementName = "TimeSlider3"; TextBlock_EndTime.SetBinding(TextBlock.TextProperty, myBinding); // Bind the Value (which is an ESRI.ArcGIS.Client.TimeExtent) from TimeSlider3 to the Map3.TimeExtentProperty. // This will update the Map automatically as the slider moves. System.Windows.Data.Binding myBinding2 = new System.Windows.Data.Binding("Value"); myBinding2.Mode = System.Windows.Data.BindingMode.OneWay; myBinding2.ElementName = "TimeSlider3"; Map3.SetBinding(ESRI.ArcGIS.Client.Map.TimeExtentProperty, myBinding2); // Since the TimeSlider3.Value Property is bound to the Map3.TimeExtentProperty Field, it is needed to // code the Rendering (via the TemporalRenderer) into the FeatureLayer's Initialized event so that // automatic updating of the FeatureLayer will occur as the user interacts with the TimeSlider. // Note: You can specify any name for the for the AddressOf function. myFeatureLayer3.Initialized += new System.EventHandler<EventArgs>(FeatureLayerHurricanes_Initialized); } private void FeatureLayerHurricanes_Initialized(object sender, System.EventArgs e) { // This function performs all of the rendering (or drawing) of the FeatureLayer using a TemporalRenderer. // Get the FeatureLayer forom the Map's Layers Collection. ESRI.ArcGIS.Client.FeatureLayer myFeatureLayer2 = (ESRI.ArcGIS.Client.FeatureLayer)Map3.Layers["hurricane"]; // Create the TemporalRenderer. ESRI.ArcGIS.Client.TemporalRenderer myTemporalRenderer = new ESRI.ArcGIS.Client.TemporalRenderer(); //------------------------------------------------------------------------------------------- // Prepare everything for setting the TemporalRenderer.ObservationRenderer Properety: // // In this example a ClassBreaksBrenderer will be used to make a solid black circle symbol become // larger as the size of hurricane Alberto grows via it's wind speed. // Create the ClassBreaksRenderer and set the Field value for which groups will be defined. // The FeatureLayer.OutFields Property set in the MainPage_Loaded function was set to return // all the fields via the wildcard character (*) and hence we can specify "WINDSPEED". ESRI.ArcGIS.Client.ClassBreaksRenderer myClassBreaksRenderer = new ESRI.ArcGIS.Client.ClassBreaksRenderer(); myClassBreaksRenderer.Field = "WINDSPEED"; // Requires a numeric Field // Define the Default symbol ESRI.ArcGIS.Client.Symbols.SimpleMarkerSymbol myDefaultMarkerSymbol = new ESRI.ArcGIS.Client.Symbols.SimpleMarkerSymbol(); System.Windows.Media.SolidColorBrush myDefaultBrush = new System.Windows.Media.SolidColorBrush(Color.FromArgb(255, 0, 0, 0)); //Black myDefaultMarkerSymbol.Color = myDefaultBrush; myDefaultMarkerSymbol.Size = 1; myClassBreaksRenderer.DefaultSymbol = myDefaultMarkerSymbol; // Tropical Depression ESRI.ArcGIS.Client.ClassBreakInfo myClassBreakInfo1 = new ESRI.ArcGIS.Client.ClassBreakInfo(); myClassBreakInfo1.MinimumValue = 0; myClassBreakInfo1.MaximumValue = 39; myClassBreakInfo1.Description = "0 to 38 MPH"; myClassBreakInfo1.Label = "Tropical Depression"; ESRI.ArcGIS.Client.Symbols.SimpleMarkerSymbol mySimpleMarkerSymbol1 = new ESRI.ArcGIS.Client.Symbols.SimpleMarkerSymbol(); System.Windows.Media.SolidColorBrush myBrush1 = new System.Windows.Media.SolidColorBrush(Color.FromArgb(255, 0, 0, 0)); //Black mySimpleMarkerSymbol1.Color = myBrush1; mySimpleMarkerSymbol1.Size = 5; myClassBreakInfo1.Symbol = mySimpleMarkerSymbol1; myClassBreaksRenderer.Classes.Add(myClassBreakInfo1); // Tropical Storm ESRI.ArcGIS.Client.ClassBreakInfo myClassBreakInfo2 = new ESRI.ArcGIS.Client.ClassBreakInfo(); myClassBreakInfo2.MinimumValue = 39; myClassBreakInfo2.MaximumValue = 74; myClassBreakInfo2.Description = "39 to 73 MPH"; myClassBreakInfo2.Label = "Tropical Storm"; ESRI.ArcGIS.Client.Symbols.SimpleMarkerSymbol mySimpleMarkerSymbol2 = new ESRI.ArcGIS.Client.Symbols.SimpleMarkerSymbol(); System.Windows.Media.SolidColorBrush myBrush2 = new System.Windows.Media.SolidColorBrush(Color.FromArgb(255, 0, 0, 0)); // Black mySimpleMarkerSymbol2.Color = myBrush2; mySimpleMarkerSymbol2.Size = 8; myClassBreakInfo2.Symbol = mySimpleMarkerSymbol2; myClassBreaksRenderer.Classes.Add(myClassBreakInfo2); // Hurricane Category I ESRI.ArcGIS.Client.ClassBreakInfo myClassBreakInfo3 = new ESRI.ArcGIS.Client.ClassBreakInfo(); myClassBreakInfo3.MinimumValue = 74; myClassBreakInfo3.MaximumValue = 96; myClassBreakInfo3.Description = "74 to 95 MPH"; myClassBreakInfo3.Label = "Hurricane Category I"; ESRI.ArcGIS.Client.Symbols.SimpleMarkerSymbol mySimpleMarkerSymbol3 = new ESRI.ArcGIS.Client.Symbols.SimpleMarkerSymbol(); System.Windows.Media.SolidColorBrush myBrush3 = new System.Windows.Media.SolidColorBrush(Color.FromArgb(255, 0, 0, 0)); // Black mySimpleMarkerSymbol3.Color = myBrush3; mySimpleMarkerSymbol3.Size = 11; myClassBreakInfo3.Symbol = mySimpleMarkerSymbol3; myClassBreaksRenderer.Classes.Add(myClassBreakInfo3); // Hurricane Category II ESRI.ArcGIS.Client.ClassBreakInfo myClassBreakInfo4 = new ESRI.ArcGIS.Client.ClassBreakInfo(); myClassBreakInfo4.MinimumValue = 96; myClassBreakInfo4.MaximumValue = 111; myClassBreakInfo4.Description = "96 to 110 MPH"; myClassBreakInfo4.Label = "Hurricane Category II"; ESRI.ArcGIS.Client.Symbols.SimpleMarkerSymbol mySimpleMarkerSymbol4 = new ESRI.ArcGIS.Client.Symbols.SimpleMarkerSymbol(); System.Windows.Media.SolidColorBrush myBrush4 = new System.Windows.Media.SolidColorBrush(Color.FromArgb(255, 0, 0, 0)); // Black mySimpleMarkerSymbol4.Color = myBrush4; mySimpleMarkerSymbol4.Size = 13; myClassBreakInfo4.Symbol = mySimpleMarkerSymbol4; myClassBreaksRenderer.Classes.Add(myClassBreakInfo4); // Hurricane Category III ESRI.ArcGIS.Client.ClassBreakInfo myClassBreakInfo5 = new ESRI.ArcGIS.Client.ClassBreakInfo(); myClassBreakInfo5.MinimumValue = 111; myClassBreakInfo5.MaximumValue = 131; myClassBreakInfo5.Description = "111 to 130 MPH"; myClassBreakInfo5.Label = "Hurricane Category III"; ESRI.ArcGIS.Client.Symbols.SimpleMarkerSymbol mySimpleMarkerSymbol5 = new ESRI.ArcGIS.Client.Symbols.SimpleMarkerSymbol(); System.Windows.Media.SolidColorBrush myBrush5 = new System.Windows.Media.SolidColorBrush(Color.FromArgb(255, 0, 0, 0)); // Black mySimpleMarkerSymbol5.Color = myBrush5; mySimpleMarkerSymbol5.Size = 15; myClassBreakInfo5.Symbol = mySimpleMarkerSymbol5; myClassBreaksRenderer.Classes.Add(myClassBreakInfo5); // There are actually five hurricane categories. You can create the other two if desired. // Category IV (131 to 155 MPH) and Category V (156+ MPH) // Apply the ObservationRenderer information to the TemporalRenderer. myTemporalRenderer.ObservationRenderer = myClassBreaksRenderer; //------------------------------------------------------------------------------------------- // Prepare everything for setting the TrackRenderer Property: // // Setting the TrackIdField draws polylines in time order for a group of attributes. If the // TrackIdField property is not set and the TrackRenderer is used, then all point observations // will have a polyline connecting them in order of time. This becomes messy if multiple // events are occurring at the same time (i.e. hurricanes) and the linework would then look like // a spider diagram rather than discreet tracks with one per event. In this example to speed up // drawing time and limit the amount of data that is returned, the FeatureLayer.Where clause was // used to restrict only one hurricane (or event) from displaying. If the FeatureLayer.Where // clause was commented out, multiple hurricanes would be displayed -- having the TrackIdField // becomes key to keeping each event separate. // The FeatureLayer.OutFields Property set in the MainPage_Loaded function was set to return // all the fields via the wildcard character (*) and hence we can specify "EVENTID". myTemporalRenderer.TrackIdField = "EVENTID"; // Define a SimpleRenderer with a SimpleLineSymbol to display each tracked event. The event // will be a yellow line connecting the time-based observations. ESRI.ArcGIS.Client.SimpleRenderer myTrackRenderer = new ESRI.ArcGIS.Client.SimpleRenderer(); ESRI.ArcGIS.Client.Symbols.SimpleLineSymbol defaultSimpleLineSymbol3 = new ESRI.ArcGIS.Client.Symbols.SimpleLineSymbol(); System.Windows.Media.SolidColorBrush defaultBrush3 = new System.Windows.Media.SolidColorBrush(Color.FromArgb(255, 255, 255, 0)); //Yellow defaultSimpleLineSymbol3.Color = defaultBrush3; defaultSimpleLineSymbol3.Width = 2; myTrackRenderer.Symbol = defaultSimpleLineSymbol3; // Apply the TrackRenderer information to the TemporalRenderer. myTemporalRenderer.TrackRenderer = myTrackRenderer; //------------------------------------------------------------------------------------------- // Prepare everything for setting the LatestObservationRenderer Property: // // If you do not want the last observation point in the returned set of features to be rendered // differently, then do not use the LatestObservationRenderer. If no Map3.TimeExtent is set then // the LastObservationRenderer will not be drawn. // Define a SimpleRenderer with a SimpleMarkerSymbol to display each observation. The last // observation will be a red diamond. ESRI.ArcGIS.Client.SimpleRenderer mySimpleRenderer = new ESRI.ArcGIS.Client.SimpleRenderer(); ESRI.ArcGIS.Client.Symbols.SimpleMarkerSymbol mySymbol = new ESRI.ArcGIS.Client.Symbols.SimpleMarkerSymbol(); System.Windows.Media.SolidColorBrush defaultBrush = new System.Windows.Media.SolidColorBrush(Color.FromArgb(255, 255, 0, 0)); //Red mySymbol.Color = defaultBrush; mySymbol.Size = 10; mySymbol.Style = ESRI.ArcGIS.Client.Symbols.SimpleMarkerSymbol.SimpleMarkerStyle.Diamond; mySimpleRenderer.Symbol = mySymbol; myTemporalRenderer.LatestObservationRenderer = mySimpleRenderer; //------------------------------------------------------------------------------------------- // Prepare everything for setting the SymbolAger Property: // // The SymbolAger will override the default rendering provided by the ObservationRenderer as the // TimeExtentProperty for the Map changes. The goal is to provide rendering to show how a phenomena // has changed over time. // // Use a RampInterpolator as the SymbolAger. The RampInterpolator will provide an interpolation // of up to three attributes for a symbol (Color, Opacity, and Size) between the TimeExtentProperty // specified. You specify the From and To values for the desired attributes and the interpolation // occurs automatically between them based upon the TimeExtent. // // In this example only the Opacity attribute of the RampInterpolator is being use to show that // as hurricane Alberto ages (i.e. gets older) the visibility of the symbol at its historical // spatial location begins to fade. Uncomment the other RampInterpolator attributes (Color and // Size) to see how they impact the visulazation. Note: by ramping the Size of the of the symbol // of the using a RampInterpolator overrides the effect of the ClassBreaksRenderer where the // hurricanes "WINDSPEED" was used to define the size. ESRI.ArcGIS.Client.RampInterpolator myRampInterpolator = new ESRI.ArcGIS.Client.RampInterpolator(); ESRI.ArcGIS.Client.OpacityRange myOpacityRange = new ESRI.ArcGIS.Client.OpacityRange(); myOpacityRange.From = 1; //1 = solid myOpacityRange.To = 0.2; //0 = invisible myRampInterpolator.OpacityRange = myOpacityRange; //Dim myColorRange As New ESRI.ArcGIS.Client.ColorRange //myColorRange.From = Color.FromArgb(255, 0, 255, 0) 'Green //myColorRange.To = Color.FromArgb(255, 255, 0, 0) 'Red //myRampInterpolator.ColorRange = myColorRange //Dim mySizeRange As New ESRI.ArcGIS.Client.SizeRange //mySizeRange.From = 30 //mySizeRange.To = 5 //myRampInterpolator.SizeRange = mySizeRange // Apply the SymbolAger information to the TemporalRenderer. myTemporalRenderer.SymbolAger = myRampInterpolator; //------------------------------------------------------------------------------------------- // Finally, apply the TemporalRenderer information to the FeatureLayer Renderer. myFeatureLayer2.Renderer = myTemporalRenderer; } | |
| VB.NET | Copy Code |
|---|---|
Private Sub MainPage_Loaded(ByVal sender As Object, ByVal e As System.Windows.RoutedEventArgs) Handles Me.Loaded ' Initialize the controls upon application startup. ' In this example it is assumed that the following controls were previously added in XAML: ' Map3 <== ESRI.ArcGIS.Client.Map Control ' TimeSlider3 <== ESRI.ArcGIS.Client.Toolkit.TimeSlider Control ' TextBlock_StartTime <== System.Windows.Controls.TextBlock ' TextBlock_EndTime <== System.Windows.Controls.TextBlock ' Add an ArcGISTiledMapsServiceLayer as a background to the map. Note: The first Layer added to the Map's ' Layers Collection is on the bottom and the other Layer is added on the top. Dim myArcGISTiledMapServiceLayer1 As New ESRI.ArcGIS.Client.ArcGISTiledMapServiceLayer myArcGISTiledMapServiceLayer1.Url = "http://services.arcgisonline.com/ArcGIS/rest/services/ESRI_StreetMap_World_2D/MapServer" Map3.Layers.Add(myArcGISTiledMapServiceLayer1) ' Add a FeatureLayer to the map. Note: This Layer is drawn on top of the background layer. Dim myFeatureLayer3 As New ESRI.ArcGIS.Client.FeatureLayer myFeatureLayer3.ID = "hurricane" ' A FeatureLayer that is Time enabled and contains hurricane data from NOAA. myFeatureLayer3.Url = "http://servicesbeta.esri.com/ArcGIS/rest/services/Hurricanes/Hurricanes/MapServer/0" ' The Where clause is optional. It is necessary when more that 500/1000 records returned. In ArcGIS Server ' 9.3.1 and prior, the default maximum is 500 records returned per FeatureLayer. In ArcGIS Server 10 the ' default is 1000. This setting is configurable per map service using ArcCatalog or ArcGIS Server Manager ' (on the Parameters tab). myFeatureLayer3.Where = "EVENTID = 'Alberto'" 'Only display hurricane data for Alberto. ' Specify the Outfields Property to specify which Fields are returned on which the TemporalRenderer.TrackIdField ' and the Client.ClassBreaksRenderer can use. Specifying the wildcard (*) character in the Add Property will ' return all Fields. myFeatureLayer3.OutFields.Add("*") ' Add the myFeatureLayer3 to the Map3 Layers Collection. Map3.Layers.Add(myFeatureLayer3) ' Zoom to the middle of the Atlantic Ocean. Dim myEnvelope3 As New ESRI.ArcGIS.Client.Geometry.Envelope myEnvelope3.XMin = -82.08 myEnvelope3.YMin = 2.81 myEnvelope3.XMax = -16.17 myEnvelope3.YMax = 68.73 Map3.Extent = myEnvelope3 ' Setting the Map's TimeExtent acts like a Where clause in that only those features/records that fall ' within the set TimeExtent will then be shown. If no Map.TimeExtent is set then only the ' ObservationRenderer is in effect. If a Map.TimeExtent is set then the ObservationRenderer and the ' LastObservationRenderer and TrackRenderer are in effect. In the case of this example ' the TimeExtent for the hurricane Alberto is shortened to a small temporal window to display the ' various rendering effects clearly. Dim myTimeExtent As New ESRI.ArcGIS.Client.TimeExtent Dim dateStart As Date = #8/4/2000 12:00:01 AM# 'Alberto Start myTimeExtent.Start = dateStart Dim dateEnd As Date = #8/24/2000 6:00:01 AM# 'Alberto End myTimeExtent.End = dateEnd ' Set the minimum and maximum values of the TimeSlider3. TimeSlider3.MinimumValue = myTimeExtent.Start TimeSlider3.MaximumValue = myTimeExtent.End ' Create another TimeExtent with the beginning and ending date being the same. This will set where the ' slider is along the TimeSlider control. In our case we want it at the beginning. Dim myTimeExtentX As New ESRI.ArcGIS.Client.TimeExtent Dim dateStartX As Date = #8/4/2000 12:00:01 AM# 'Alberto Start! myTimeExtentX.Start = dateStartX Dim dateEndX As Date = #8/4/2000 12:00:01 AM# 'Alberto Start! myTimeExtentX.End = dateEndX TimeSlider3.Value = myTimeExtentX ' Define the text above the TimeSlider that tells what is the start date/time. TextBlock_StartTime.Text = dateStart.ToString ' Bind the Value.End (which is a Date) from TimeSlider3 to the TextBlock_EndTime.TextProperty. This ' will update the text automatically as the slider moves. Dim myBinding As System.Windows.Data.Binding = New System.Windows.Data.Binding("Value.End") myBinding.Mode = System.Windows.Data.BindingMode.OneWay myBinding.ElementName = "TimeSlider3" TextBlock_EndTime.SetBinding(TextBlock.TextProperty, myBinding) ' Bind the Value (which is an ESRI.ArcGIS.Client.TimeExtent) from TimeSlider3 to the Map3.TimeExtentProperty. ' This will update the Map automatically as the slider moves. Dim myBinding2 As System.Windows.Data.Binding = New System.Windows.Data.Binding("Value") myBinding2.Mode = System.Windows.Data.BindingMode.OneWay myBinding2.ElementName = "TimeSlider3" Map3.SetBinding(ESRI.ArcGIS.Client.Map.TimeExtentProperty, myBinding2) ' Since the TimeSlider3.Value Property is bound to the Map3.TimeExtentProperty Field, it is needed to ' code the Rendering (via the TemporalRenderer) into the FeatureLayer's Initialized event so that ' automatic updating of the FeatureLayer will occur as the user interacts with the TimeSlider. ' Note: You can specify any name for the for the AddressOf function. AddHandler myFeatureLayer3.Initialized, AddressOf FeatureLayerHurricanes_Initialized End Sub Private Sub FeatureLayerHurricanes_Initialized(ByVal sender As System.Object, ByVal e As System.EventArgs) ' This function performs all of the rendering (or drawing) of the FeatureLayer using a TemporalRenderer. ' Get the FeatureLayer forom the Map's Layers Collection. Dim myFeatureLayer2 As ESRI.ArcGIS.Client.FeatureLayer = Map3.Layers.Item("hurricane") ' Create the TemporalRenderer. Dim myTemporalRenderer As New ESRI.ArcGIS.Client.TemporalRenderer '------------------------------------------------------------------------------------------- ' Prepare everything for setting the TemporalRenderer.ObservationRenderer Properety: ' ' In this example a ClassBreaksBrenderer will be used to make a solid black circle symbol become ' larger as the size of hurricane Alberto grows via it's wind speed. ' Create the ClassBreaksRenderer and set the Field value for which groups will be defined. ' The FeatureLayer.OutFields Property set in the MainPage_Loaded function was set to return ' all the fields via the wildcard character (*) and hence we can specify "WINDSPEED". Dim myClassBreaksRenderer As New ESRI.ArcGIS.Client.ClassBreaksRenderer myClassBreaksRenderer.Field = "WINDSPEED" ' Requires a numeric Field ' Define the Default symbol Dim myDefaultMarkerSymbol As New ESRI.ArcGIS.Client.Symbols.SimpleMarkerSymbol Dim myDefaultBrush As New System.Windows.Media.SolidColorBrush(Color.FromArgb(255, 0, 0, 0)) 'Black myDefaultMarkerSymbol.Color = myDefaultBrush myDefaultMarkerSymbol.Size = 1 myClassBreaksRenderer.DefaultSymbol = myDefaultMarkerSymbol ' Tropical Depression Dim myClassBreakInfo1 As New ESRI.ArcGIS.Client.ClassBreakInfo myClassBreakInfo1.MinimumValue = 0 myClassBreakInfo1.MaximumValue = 39 myClassBreakInfo1.Description = "0 to 38 MPH" myClassBreakInfo1.Label = "Tropical Depression" Dim mySimpleMarkerSymbol1 As New ESRI.ArcGIS.Client.Symbols.SimpleMarkerSymbol Dim myBrush1 As New System.Windows.Media.SolidColorBrush(Color.FromArgb(255, 0, 0, 0)) 'Black mySimpleMarkerSymbol1.Color = myBrush1 mySimpleMarkerSymbol1.Size = 5 myClassBreakInfo1.Symbol = mySimpleMarkerSymbol1 myClassBreaksRenderer.Classes.Add(myClassBreakInfo1) ' Tropical Storm Dim myClassBreakInfo2 As New ESRI.ArcGIS.Client.ClassBreakInfo myClassBreakInfo2.MinimumValue = 39 myClassBreakInfo2.MaximumValue = 74 myClassBreakInfo2.Description = "39 to 73 MPH" myClassBreakInfo2.Label = "Tropical Storm" Dim mySimpleMarkerSymbol2 As New ESRI.ArcGIS.Client.Symbols.SimpleMarkerSymbol Dim myBrush2 As New System.Windows.Media.SolidColorBrush(Color.FromArgb(255, 0, 0, 0)) ' Black mySimpleMarkerSymbol2.Color = myBrush2 mySimpleMarkerSymbol2.Size = 8 myClassBreakInfo2.Symbol = mySimpleMarkerSymbol2 myClassBreaksRenderer.Classes.Add(myClassBreakInfo2) ' Hurricane Category I Dim myClassBreakInfo3 As New ESRI.ArcGIS.Client.ClassBreakInfo myClassBreakInfo3.MinimumValue = 74 myClassBreakInfo3.MaximumValue = 96 myClassBreakInfo3.Description = "74 to 95 MPH" myClassBreakInfo3.Label = "Hurricane Category I" Dim mySimpleMarkerSymbol3 As New ESRI.ArcGIS.Client.Symbols.SimpleMarkerSymbol Dim myBrush3 As New System.Windows.Media.SolidColorBrush(Color.FromArgb(255, 0, 0, 0)) ' Black mySimpleMarkerSymbol3.Color = myBrush3 mySimpleMarkerSymbol3.Size = 11 myClassBreakInfo3.Symbol = mySimpleMarkerSymbol3 myClassBreaksRenderer.Classes.Add(myClassBreakInfo3) ' Hurricane Category II Dim myClassBreakInfo4 As New ESRI.ArcGIS.Client.ClassBreakInfo myClassBreakInfo4.MinimumValue = 96 myClassBreakInfo4.MaximumValue = 111 myClassBreakInfo4.Description = "96 to 110 MPH" myClassBreakInfo4.Label = "Hurricane Category II" Dim mySimpleMarkerSymbol4 As New ESRI.ArcGIS.Client.Symbols.SimpleMarkerSymbol Dim myBrush4 As New System.Windows.Media.SolidColorBrush(Color.FromArgb(255, 0, 0, 0)) ' Black mySimpleMarkerSymbol4.Color = myBrush4 mySimpleMarkerSymbol4.Size = 13 myClassBreakInfo4.Symbol = mySimpleMarkerSymbol4 myClassBreaksRenderer.Classes.Add(myClassBreakInfo4) ' Hurricane Category III Dim myClassBreakInfo5 As New ESRI.ArcGIS.Client.ClassBreakInfo myClassBreakInfo5.MinimumValue = 111 myClassBreakInfo5.MaximumValue = 131 myClassBreakInfo5.Description = "111 to 130 MPH" myClassBreakInfo5.Label = "Hurricane Category III" Dim mySimpleMarkerSymbol5 As New ESRI.ArcGIS.Client.Symbols.SimpleMarkerSymbol Dim myBrush5 As New System.Windows.Media.SolidColorBrush(Color.FromArgb(255, 0, 0, 0)) ' Black mySimpleMarkerSymbol5.Color = myBrush5 mySimpleMarkerSymbol5.Size = 15 myClassBreakInfo5.Symbol = mySimpleMarkerSymbol5 myClassBreaksRenderer.Classes.Add(myClassBreakInfo5) ' There are actually five hurricane categories. You can create the other two if desired. ' Category IV (131 to 155 MPH) and Category V (156+ MPH) ' Apply the ObservationRenderer information to the TemporalRenderer. myTemporalRenderer.ObservationRenderer = myClassBreaksRenderer '------------------------------------------------------------------------------------------- ' Prepare everything for setting the TrackRenderer Property: ' ' Setting the TrackIdField draws polylines in time order for a group of attributes. If the ' TrackIdField property is not set and the TrackRenderer is used, then all point observations ' will have a polyline connecting them in order of time. This becomes messy if multiple ' events are occurring at the same time (i.e. hurricanes) and the linework would then look like ' a spider diagram rather than discreet tracks with one per event. In this example to speed up ' drawing time and limit the amount of data that is returned, the FeatureLayer.Where clause was ' used to restrict only one hurricane (or event) from displaying. If the FeatureLayer.Where ' clause was commented out, multiple hurricanes would be displayed -- having the TrackIdField ' becomes key to keeping each event separate. ' The FeatureLayer.OutFields Property set in the MainPage_Loaded function was set to return ' all the fields via the wildcard character (*) and hence we can specify "EVENTID". myTemporalRenderer.TrackIdField = "EVENTID" ' Define a SimpleRenderer with a SimpleLineSymbol to display each tracked event. The event ' will be a yellow line connecting the time-based observations. Dim myTrackRenderer As New ESRI.ArcGIS.Client.SimpleRenderer Dim defaultSimpleLineSymbol3 As New ESRI.ArcGIS.Client.Symbols.SimpleLineSymbol Dim defaultBrush3 As New System.Windows.Media.SolidColorBrush(Color.FromArgb(255, 255, 255, 0)) 'Yellow defaultSimpleLineSymbol3.Color = defaultBrush3 defaultSimpleLineSymbol3.Width = 2 myTrackRenderer.Symbol = defaultSimpleLineSymbol3 ' Apply the TrackRenderer information to the TemporalRenderer. myTemporalRenderer.TrackRenderer = myTrackRenderer '------------------------------------------------------------------------------------------- ' Prepare everything for setting the LatestObservationRenderer Property: ' ' If you do not want the last observation point in the returned set of features to be rendered ' differently, then do not use the LatestObservationRenderer. If no Map3.TimeExtent is set then ' the LastObservationRenderer will not be drawn. ' Define a SimpleRenderer with a SimpleMarkerSymbol to display each observation. The last ' observation will be a red diamond. Dim mySimpleRenderer As New ESRI.ArcGIS.Client.SimpleRenderer Dim mySymbol As New ESRI.ArcGIS.Client.Symbols.SimpleMarkerSymbol Dim defaultBrush As New System.Windows.Media.SolidColorBrush(Color.FromArgb(255, 255, 0, 0)) 'Red mySymbol.Color = defaultBrush mySymbol.Size = 10 mySymbol.Style = ESRI.ArcGIS.Client.Symbols.SimpleMarkerSymbol.SimpleMarkerStyle.Diamond mySimpleRenderer.Symbol = mySymbol myTemporalRenderer.LatestObservationRenderer = mySimpleRenderer '------------------------------------------------------------------------------------------- ' Prepare everything for setting the SymbolAger Property: ' ' The SymbolAger will override the default rendering provided by the ObservationRenderer as the ' TimeExtentProperty for the Map changes. The goal is to provide rendering to show how a phenomena ' has changed over time. ' ' Use a RampInterpolator as the SymbolAger. The RampInterpolator will provide an interpolation ' of up to three attributes for a symbol (Color, Opacity, and Size) between the TimeExtentProperty ' specified. You specify the From and To values for the desired attributes and the interpolation ' occurs automatically between them based upon the TimeExtent. ' ' In this example only the Opacity attribute of the RampInterpolator is being use to show that ' as hurricane Alberto ages (i.e. gets older) the visibility of the symbol at its historical ' spatial location begins to fade. Uncomment the other RampInterpolator attributes (Color and ' Size) to see how they impact the visulazation. Note: by ramping the Size of the of the symbol ' of the using a RampInterpolator overrides the effect of the ClassBreaksRenderer where the ' hurricanes "WINDSPEED" was used to define the size. Dim myRampInterpolator As New ESRI.ArcGIS.Client.RampInterpolator Dim myOpacityRange As New ESRI.ArcGIS.Client.OpacityRange myOpacityRange.From = 1 '1 = solid myOpacityRange.To = 0.2 '0 = invisible myRampInterpolator.OpacityRange = myOpacityRange 'Dim myColorRange As New ESRI.ArcGIS.Client.ColorRange 'myColorRange.From = Color.FromArgb(255, 0, 255, 0) 'Green 'myColorRange.To = Color.FromArgb(255, 255, 0, 0) 'Red 'myRampInterpolator.ColorRange = myColorRange 'Dim mySizeRange As New ESRI.ArcGIS.Client.SizeRange 'mySizeRange.From = 30 'mySizeRange.To = 5 'myRampInterpolator.SizeRange = mySizeRange ' Apply the SymbolAger information to the TemporalRenderer. myTemporalRenderer.SymbolAger = myRampInterpolator '------------------------------------------------------------------------------------------- ' Finally, apply the TemporalRenderer information to the FeatureLayer Renderer. myFeatureLayer2.Renderer = myTemporalRenderer End Sub | |
Remarks
The ObservationRenderer Property provides a default set of symbology for features in a time-based layer. This default symbology can be overridden by the LatestObservationRenderer and the TrackRenderer to provide additional ways to graphically represent the features that are returned from a FeatureLayer. While it is theoretically possible to have any Renderer that Implements the IRenderer Interface be used as the ObservationRenderer Property, it typically makes sense to only use a SimpleRenderer, ClassBreaksRenderer, or UniqueValueRenderer.
The LatestObservationRenderer Property provides a default set of symbology for the last time-based feature returned per TrackIdField. If no TrackIdField has been specified then just the last observation that is returned from the FeatureLayer will be symbolized. Whatever symbology properties that have been set (for example: a Symbol’s Color, Size, and Style) for the LatestObservationRenderer will override what was set for the ObservationRenderer. While it is theoretically possible to have any Renderer that Implements the IRenderer Interface be used as the LastObservationRenderer Property, it typically makes sense to only use a SimpleRenderer, ClassBreaksRenderer, or UniqueValueRenderer.
The TrackRenderer Property provides polyline based symbology that connects markers (i.e. Points) for time-based features per TrackIdField. If no TrackIdField has been specified then all observations that are returned from the Featurelayer will be symbolized in sequential order using the polyline graphic. The polyline graphic that is drawn begins with the first temporal observation and connects-the-dots as the phenomena moves spatially through time.
The SymbolAger Property is an optional technique to modify a Symbol’s Size, Color, and Opacity for the Renderers applied to the TemporalRenderer as a feature’s time stamp adjusts. Two SymbolAger’s are supported: the RampInterpolator and the TimeClassBreaksAger. The RampInterpolator will modify the rendering of entire set of features and graduate the symbology based upon the set properties (except for the LastObservationRenderer). The TimeClassBreaksAger will modify the rendering of a specific set of defined groups based upon a range of values. If a specific group has not been defined by the TimeClassBreaksAger then the ObservationRenderer will take precedence; additionally the LastObservationRenderer takes precedence if set).
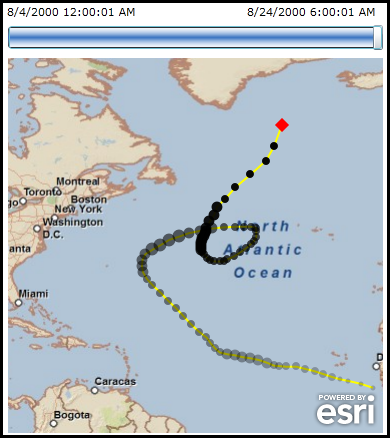
The following screen shot depicts an image of hurricane Alberto moving across the Atlantic Ocean. The black circles are defined as the movement of Alberto. The circles get larger and smaller depending on Alberto’s measured wind speed via a ClassBreaksRenderer. The red diamond is the most recent occurrence of Alberto’s movement as defined by the TimeExtent of the FeatureLayer. A TrackRenderer is used to denote the path of Alberto’s movement via a yellow solid line that connects the back circles. A SymbolAger via a RampInterpolator was used to demonstrate that as Alberto’s time observations get older, the symbology of the black circles begin to fade. The screen shot matches the code example provided in this documentation page.
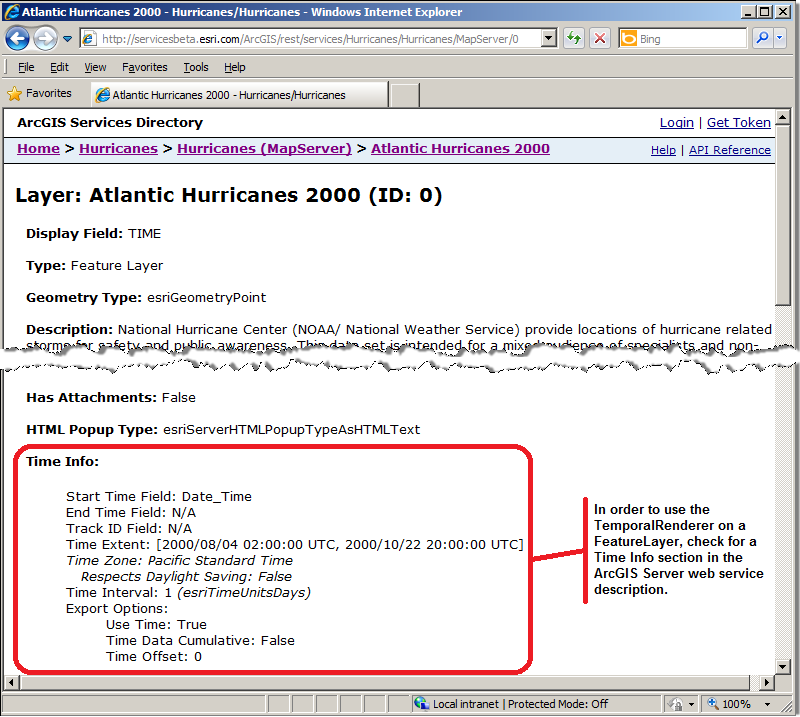
The TemporalRenderer Class is only useful to render graphics from a FeatureLayer that has time based data explicitly specified by an ArcGIS Server web service. One way to determine if the FeatureLayer is temporally enabled is to copy the FeatureLayer.Url Property into the address bar of a web browser and then scroll through the ArcGIS Server web service description to look for for a Time Info section. See the following screen shot:
Inheritance Hierarchy
System.Object
System.Windows.Threading.DispatcherObject
System.Windows.DependencyObject
ESRI.ArcGIS.Client.TemporalRenderer
Requirements
Target Platforms: Windows XP Professional, Windows Server 2003 family, Windows Vista, Windows Server 2008 family