


 Object Model
Syntax
| Visual Basic (Declaration) | |
|---|---|
Public NotInheritable Class ClassBreaksRenderer Inherits System.Windows.DependencyObject Implements IJsonSerializable, ILegendSupport, IRenderer | |
| C# | |
|---|---|
public sealed class ClassBreaksRenderer : System.Windows.DependencyObject, IJsonSerializable, ILegendSupport, IRenderer | |
Example
| XAML |  Copy Code Copy Code |
|---|---|
<!-- Important information regarding this code: This XAML provides three examples of using the ClassBreaksRenderer with different symbology (Marker, Line, and Fill). Each example is nested within it's own <Grid/> block. Copy just one example within each into your test project. Do not copy this entire XAML code into your test project as it will not work with three <Grid/>'s overlapping. --> <Grid x:Name="LayoutRoot" Background="White"> <!-- Marker Example: This example shows how to draw Markers (aka. Points) on a FeatureLayer using the ClassBreaksRenderer Class. This example takes two Map controls as arguments to compare the effect of applying a ClassBreaksRenderer. Map1 will show a basic FeatureLayer that comes by default from ArcGIS Server. Map2 will show the same FeatureLayer but with a specific ClassBreaksRenderer applied, to compare the differences. --> <!-- Display the default FeatureLayer in myMap1: Add an ArcGISTiledMapsServiceLayer as a background to the map. Note: The ArcGISTiledMapsServiceLayer layer is first Layer added to the Map's Layers Collection and is drawn on the bottom. A FeatureLayer is then added to the map and draws on top of the background layer. Set the Map1 Extent to zoom to the continental United States. --> <esri:Map Background="White" HorizontalAlignment="Left" Margin="12,227,0,0" Name="Map1" VerticalAlignment="Top" Height="375" Width="375" Extent="-130,10,-70,60" > <esri:ArcGISTiledMapServiceLayer ID="StreetMapLayer1" Url="http://services.arcgisonline.com/ArcGIS/rest/services/ESRI_StreetMap_World_2D/MapServer"/> <!-- The FeatureLayer contains United States cities as Markers (aka. Points). The Where clause for the FeatureLayer is optional. The Where clause is necessary when more that 500/1000 records returned. In ArcGIS Server 9.3.1 and prior, the default maximum is 500 records returned per FeatureLayer. In ArcGIS Server 10 the default is 1000. This setting is configurable per map service using ArcCatalog or ArcGIS Server Manager (on the Parameters tab). --> <esri:FeatureLayer ID="MyFeatureLayer1" Url="http://sampleserver1.arcgisonline.com/ArcGIS/rest/services/Specialty/ESRI_StatesCitiesRivers_USA/MapServer/0" Where="POP1990 > 100000" /> </esri:Map> <!-- Display the FeatureLayer in myMap2 that has a ClassBreaksRenderer applied: Add an ArcGISTiledMapsServiceLayer as a background to the map. Note: The ArcGISTiledMapsServiceLayer layer is first Layer added to the Map's Layers Collection and is drawn on the bottom. A FeatureLayer is then added to the map and draws on top of the background layer. Set the Map2 Extent to zoom to the continental United States. --> <esri:Map Background="White" Height="375" HorizontalAlignment="Left" Margin="408,227,0,0" Name="Map2" VerticalAlignment="Top" Width="375" Extent="-130,10,-70,60" > <esri:ArcGISTiledMapServiceLayer ID="StreetMapLayer2" Url="http://services.arcgisonline.com/ArcGIS/rest/services/ESRI_StreetMap_World_2D/MapServer"/> <!-- The FeatureLayer contains United States cities as Markers (aka. Points). The Where clause for the FeatureLayer is optional. The Where clause is necessary when more that 500/1000 records returned. In ArcGIS Server 9.3.1 and prior, the default maximum is 500 records returned per FeatureLayer. In ArcGIS Server 10 the default is 1000. This setting is configurable per map service using ArcCatalog or ArcGIS Server Manager (on the Parameters tab). Specify the Outfields Property to specify which Fields are returned on which the ClassBreaksRenderer.Field can use. Specifying the wildcard (*) character in the Add Property will return all Fields. --> <esri:FeatureLayer ID="MyFeatureLayer2" Url="http://sampleserver1.arcgisonline.com/ArcGIS/rest/services/Specialty/ESRI_StatesCitiesRivers_USA/MapServer/0" Where="POP1990 > 100000" OutFields="POP1990"> <!-- Create the ClassBreakRenderer. Specify which field (via its string name) the ClassBreaksRenderer will use for breaking the rendering of the Symbols into groups. Note: The Field that is specified for the Field Property MUST be a numeric (Double, Integer, SmallInteger, or Single) Field.FieldType. To Render groups of Strings use the UniqueValueRenderer instead. --> <esri:FeatureLayer.Renderer> <esri:ClassBreaksRenderer Field="POP1990"> <!-- Define a default SimpleMarkerSymbol for a 'catch all' to draw the features for which no ClassBreaksInfo has been defined. In this example, only cities with a population (POP1990) from 20,000 to 100,000,000 have a defined ClassBreakInfo category and yet all cities with a population greater than 100,000 will be returned. Defining a default SimpleMarkerSymbol will provide symbology for those features that are greater than 100,000 but less than 200,000. If a ClassBreaksRenderer.DefaultSymbol was not defined these features would not be drawn on the Map. --> <esri:ClassBreaksRenderer.DefaultSymbol> <esri:SimpleMarkerSymbol Color="Red" Size="3"/> </esri:ClassBreaksRenderer.DefaultSymbol> <!-- NOTE: By default if no Style is specified the is specified for a SimpleMarkerSymbol the SimpleMarkerStyle.Circle is set. A ClassBreaksRenderer should have 2 or more ClassBreakInfo Classes (meaning classification or grouping) to delineate the different symbology and class break information. The next three sections of code define 3 different ClassBreakInfo Classes (or groups) and their associated symbology. --> <!-- Group #1: Create a ClassBreakInfo object as a container of information for each group. Define the minimum and maximum values for the numeric grouping of the Field defined as the ClassBreaksRenderer.Field. Add a description and label. --> <esri:ClassBreakInfo MinimumValue="200000" MaximumValue="300000" Description="200K to 300K people" Label="A cyan circle size 6"> <esri:SimpleMarkerSymbol Color="Cyan" Size="6"/> </esri:ClassBreakInfo> <!-- Group #2: Create a ClassBreakInfo object as a container of information for each group. Define the minimum and maximum values for the numeric grouping of the Field defined as the ClassBreaksRenderer.Field. Each ClassBreakInfo grouping needs a symbol to display. In this case the SimpleMarkerSymbol Style was specified to be a Triangle (rather than the default Circle). Add a description and label. --> <esri:ClassBreakInfo MinimumValue="300000" MaximumValue="750000" Description="300K to 750 people" Label="An olive triangle size 10"> <esri:SimpleMarkerSymbol Color="Olive" Size="10" Style="Triangle"/> </esri:ClassBreakInfo> <!-- Group #3: Create a ClassBreakInfo object as a container of information for each group. Define the minimum and maximum values for the numeric grouping of the Field defined as the ClassBreaksRenderer.Field. Each ClassBreakInfo grouping needs a symbol to display. In this case the SimpleMarkerSymbol Style was specified to be a Square (rather than the default Circle). Add a description and label. --> <esri:ClassBreakInfo MinimumValue="750000" MaximumValue="100000000" Description="750K to 100M people" Label="A black square size 14"> <esri:SimpleMarkerSymbol Color="Black" Size="14" Style="Square"/> </esri:ClassBreakInfo> </esri:ClassBreaksRenderer> </esri:FeatureLayer.Renderer> </esri:FeatureLayer> </esri:Map> </Grid> <Grid x:Name="LayoutRoot"> <!-- Line Example: This example shows how to draw Lines (aka. Polylines) on a FeatureLayer using the ClassBreaksRenderer Class. This example takes two Map controls as arguments to compare the effect of applying a ClassBreaksRenderer. Map1 will show a basic FeatureLayer that comes by default from ArcGIS Server. Map2 will show the same FeatureLayer but with a specific ClassBreaksRenderer applied, to compare the differences. --> <!-- Display the default FeatureLayer in myMap1: Add an ArcGISTiledMapsServiceLayer as a background to the map. Note: The ArcGISTiledMapsServiceLayer layer is first Layer added to the Map's Layers Collection and is drawn on the bottom. A FeatureLayer is then added to the map and draws on top of the background layer. Set the Map1 Extent to zoom to the continental United States. --> <esri:Map Background="White" HorizontalAlignment="Left" Margin="12,227,0,0" Name="Map1" VerticalAlignment="Top" Height="375" Width="375" Extent="-130,10,-70,60" > <esri:ArcGISTiledMapServiceLayer ID="StreetMapLayer1" Url="http://services.arcgisonline.com/ArcGIS/rest/services/ESRI_StreetMap_World_2D/MapServer"/> <!-- The FeatureLayer contains United States Interstate roads as Lines (aka. Polylines). The Where clause for the FeatureLayer is optional. The Where clause is necessary when more that 500/1000 records returned. In ArcGIS Server 9.3.1 and prior, the default maximum is 500 records returned per FeatureLayer. In ArcGIS Server 10 the default is 1000. This setting is configurable per map service using ArcCatalog or ArcGIS Server Manager (on the Parameters tab). --> <esri:FeatureLayer ID="MyFeatureLayer1" Url="http://sampleserver1.arcgisonline.com/ArcGIS/rest/services/Specialty/ESRI_StateCityHighway_USA/MapServer/0" Where="ADMN_Class='Interstate'" /> </esri:Map> <!-- Display the FeatureLayer in myMap2 that has a ClassBreaksRenderer applied: Add an ArcGISTiledMapsServiceLayer as a background to the map. Note: The ArcGISTiledMapsServiceLayer layer is first Layer added to the Map's Layers Collection and is drawn on the bottom. A FeatureLayer is then added to the map and draws on top of the background layer. Set the Map2 Extent to zoom to the continental United States. --> <esri:Map Background="White" Height="375" HorizontalAlignment="Left" Margin="408,227,0,0" Name="Map2" VerticalAlignment="Top" Width="375" Extent="-130,10,-70,60" > <esri:ArcGISTiledMapServiceLayer ID="StreetMapLayer2" Url="http://services.arcgisonline.com/ArcGIS/rest/services/ESRI_StreetMap_World_2D/MapServer"/> <!-- The FeatureLayer contains United States Interstate roads as Lines (aka. Polylines). The Where clause for the FeatureLayer is optional. The Where clause is necessary when more that 500/1000 records returned. In ArcGIS Server 9.3.1 and prior, the default maximum is 500 records returned per FeatureLayer. In ArcGIS Server 10 the default is 1000. This setting is configurable per map service using ArcCatalog or ArcGIS Server Manager (on the Parameters tab). Specify the Outfields Property to specify which Fields are returned on which the ClassBreaksRenderer.Field can use. Specifying the wildcard (*) character in the Add Property will return all Fields. --> <esri:FeatureLayer ID="MyFeatureLayer2" Url="http://sampleserver1.arcgisonline.com/ArcGIS/rest/services/Specialty/ESRI_StateCityHighway_USA/MapServer/0" Where="ADMN_Class='Interstate'" OutFields="LENGTH"> <!-- Create the ClassBreakRenderer. Specify which Field field (via its string name) the ClassBreaksRenderer will use for breaking the rendering of the Symbols into groups. Note: The Field that is specified for the Field Property MUST be a numeric (Double, Integer, SmallInteger, or Single) Field.FieldType. To Render groups of Strings use the UniqueValueRenderer instead. --> <esri:FeatureLayer.Renderer> <esri:ClassBreaksRenderer Field="LENGTH"> <!-- Define a default SimpleLineSymbol for a 'catch all' to draw the features for which no ClassBreaksInfo has been defined. In this example, only Interstate roads with a road-length (LENGTH) from 50 to 1,000 miles have a defined ClassBreakInfo category and yet all the Interstate roads will be returned (really only the first 500 features are returned due to the ArcGIS Service configuration). Defining a default SimpleLineSymbol will provide symbology for those features that have road lengths greater than 0 but less than 50 miles long. If a ClassBreaksRenderer.DefaultSymbol was not defined these features would not be drawn on the Map. --> <esri:ClassBreaksRenderer.DefaultSymbol> <esri:SimpleLineSymbol Color="Yellow" Width="5"/> </esri:ClassBreaksRenderer.DefaultSymbol> <!-- NOTE: By default if no LineStyle is specified the is specified for a SimpleLineSymbol the LineStyle.Solid is set. A ClassBreaksRenderer should have 2 or more ClassBreakInfo Classes (meaning classification or grouping) to delineate the different symbology and class break information. The next three sections of code define 3 different ClassBreakInfo Classes (or groups) and their associated symbology. --> <!-- Group #1: Create a ClassBreakInfo object as a container of information for each group. Define the minimum and maximum values for the numeric grouping of the Field defined as the ClassBreaksRenderer.Field. Add a description and label. --> <esri:ClassBreakInfo MinimumValue="50" MaximumValue="100" Description="50 to 100 miles long" Label="A cyan solid line, width 3"> <esri:SimpleLineSymbol Color="Cyan" Width="3"/> </esri:ClassBreakInfo> <!-- Group #2: Create a ClassBreakInfo object as a container of information for each group. Define the minimum and maximum values for the numeric grouping of the Field defined as the ClassBreaksRenderer.Field. Each ClassBreakInfo grouping needs a symbol to display. In this case the SimpleLineSymbol LineStyle was specified to be a Dash (rather than the default Solid). Add a description and label. --> <esri:ClassBreakInfo MinimumValue="100" MaximumValue="200" Description="100 to 200 miles long" Label="An olive dash line, width 1"> <esri:SimpleLineSymbol Color="Olive" Width="1" Style="Dash"/> </esri:ClassBreakInfo> <!-- Group #3: Create a ClassBreakInfo object as a container of information for each group. Define the minimum and maximum values for the numeric grouping of the Field defined as the ClassBreaksRenderer.Field. Each ClassBreakInfo grouping needs a symbol to display. In this case the SimpleLineSymbol LineStyle was specified to be a Dot (rather than the default Solid). Add a description and label. --> <esri:ClassBreakInfo MinimumValue="200" MaximumValue="1000" Description="200 to 1000 miles long" Label="A black dot line, width 2"> <esri:SimpleLineSymbol Color="Black" Width="2" Style="Dot"/> </esri:ClassBreakInfo> </esri:ClassBreaksRenderer> </esri:FeatureLayer.Renderer> </esri:FeatureLayer> </esri:Map> </Grid> <Grid x:Name="LayoutRoot"> <!-- Fill Example: This example shows how to draw Fills (aka. Polygons) on a FeatureLayer using the ClassBreaksRenderer Class. This example takes two Map controls as arguments to compare the effect of applying a ClassBreaksRenderer. Map1 will show a basic FeatureLayer that comes by default from ArcGIS Server. Map2 will show the same FeatureLayer but with a specific ClassBreaksRenderer applied, to compare the differences. --> <!-- Display the default FeatureLayer in myMap1: Add an ArcGISTiledMapsServiceLayer as a background to the map. Note: The ArcGISTiledMapsServiceLayer layer is first Layer added to the Map's Layers Collection and is drawn on the bottom. A FeatureLayer is then added to the map and draws on top of the background layer. Set the Map1 Extent to zoom to the continental United States. -> <esri:Map Background="White" HorizontalAlignment="Left" Margin="12,227,0,0" Name="Map1" VerticalAlignment="Top" Height="375" Width="375" Extent="-130,10,-70,60" > <esri:ArcGISTiledMapServiceLayer ID="StreetMapLayer1" Url="http://services.arcgisonline.com/ArcGIS/rest/services/ESRI_StreetMap_World_2D/MapServer"/> <!-- The FeatureLayer contains US States as Fills (aka. Polygons). The Where clause for the FeatureLayer is optional. The Where clause is necessary when more that 500/1000 records returned. In ArcGIS Server 9.3.1 and prior, the default maximum is 500 records returned per FeatureLayer. In ArcGIS Server 10 the default is 1000. This setting is configurable per map service using ArcCatalog or ArcGIS Server Manager (on the Parameters tab). Tip: The syntax "1=1" for the Where clauses returns all records! --> <esri:FeatureLayer ID="MyFeatureLayer1" Url="http://sampleserver1.arcgisonline.com/ArcGIS/rest/services/Specialty/ESRI_StatesCitiesRivers_USA/MapServer/2" Where="1=1" /> </esri:Map> <!-- Display the FeatureLayer in myMap2 that has a ClassBreaksRenderer applied: Add an ArcGISTiledMapsServiceLayer as a background to the map. Note: The ArcGISTiledMapsServiceLayer layer is first Layer added to the Map's Layers Collection and is drawn on the bottom. A FeatureLayer is then added to the map and draws on top of the background layer. Set the Map2 Extent to zoom to the continental United States. --> <esri:Map Background="White" Height="375" HorizontalAlignment="Left" Margin="408,227,0,0" Name="Map2" VerticalAlignment="Top" Width="375" Extent="-130,10,-70,60" > <esri:ArcGISTiledMapServiceLayer ID="StreetMapLayer2" Url="http://services.arcgisonline.com/ArcGIS/rest/services/ESRI_StreetMap_World_2D/MapServer"/> <!-- The FeatureLayer contains US States as Fills (aka. Polygons). The Where clause for the FeatureLayer is optional. The Where clause is necessary when more that 500/1000 records returned. In ArcGIS Server 9.3.1 and prior, the default maximum is 500 records returned per FeatureLayer. In ArcGIS Server 10 the default is 1000. This setting is configurable per map service using ArcCatalog or ArcGIS Server Manager (on the Parameters tab). Tip: The syntax "1=1" for the Where clauses returns all records! --> <esri:FeatureLayer ID="MyFeatureLayer2" Url="http://sampleserver1.arcgisonline.com/ArcGIS/rest/services/Specialty/ESRI_StatesCitiesRivers_USA/MapServer/2" Where="1=1" OutFields="*"> <!-- Create the ClassBreakRenderer. Specify which attribute field (via its string name) the ClassBreaksRenderer will use for breaking the rendering of the Symbols into groups. Note: The Field that is specified for the Field Property MUST be a numeric (Double, Integer, SmallInteger, or Single) Field.FieldType. To Render groups of Strings use the UniqueValueRenderer instead. --> <esri:FeatureLayer.Renderer> <esri:ClassBreaksRenderer Field="POP1990"> <!-- Define a default SimpleLineSymbol for a 'catch all' to draw the features for which no ClassBreaksInfo has been defined. In this example, only states with a population (POP1990) from 1,000,000 to 100,000,000 persons have a defined ClassBreakInfo category and yet all states will be returned. Defining a default SimpleFillSymbol will provide symbology for those features that are greater than 0 but less than 1,000,000. If a ClassBreaksRenderer.DefaultSymbol was not defined these features would not be drawn on the Map. --> <esri:ClassBreaksRenderer.DefaultSymbol> <esri:SimpleFillSymbol Fill="Yellow"/> </esri:ClassBreaksRenderer.DefaultSymbol> <!-- A ClassBreaksRenderer should have 2 or more ClassBreakInfo Classes (meaning classification or grouping) to delineate the different symbology and class break information. The next three sections of code define 3 different ClassBreakInfo Classes (or groups) and their associated symbology. --> <!-- Group #1: Create a ClassBreakInfo object as a container of information for each group. Define the minimum and maximum values for the numeric grouping of the Field defined as the ClassBreaksRenderer.Field. Add a description and label. --> <esri:ClassBreakInfo MinimumValue="1000000" MaximumValue="3000000" Description="1M to 3M people" Label="A cyan solid fill"> <esri:SimpleFillSymbol Fill="Cyan"/> </esri:ClassBreakInfo> <!-- Group #2: Create a ClassBreakInfo object as a container of information for each group. Define the minimum and maximum values for the numeric grouping of the Field defined as the ClassBreaksRenderer.Field. Add a description and label. --> <esri:ClassBreakInfo MinimumValue="3000000" MaximumValue="10000000" Description="3M to 10M people" Label="An olive solid fill"> <esri:SimpleFillSymbol Fill="Olive"/> </esri:ClassBreakInfo> <!-- Group #3: Create a ClassBreakInfo object as a container of information for each group. Define the minimum and maximum values for the numeric grouping of the Field defined as the ClassBreaksRenderer.Field. Add a description and label. --> <esri:ClassBreakInfo MinimumValue="10000000" MaximumValue="100000000 Description="10M to 100M people" Label="A black solid fill""> <esri:SimpleFillSymbol Fill="Black"/> </esri:ClassBreakInfo> </esri:ClassBreaksRenderer> </esri:FeatureLayer.Renderer> </esri:FeatureLayer> </esri:Map> </Grid> | |
| C# | Copy Code |
|---|---|
public void MarkerClassBreaksRenderer(ESRI.ArcGIS.Client.Map myMap1, ESRI.ArcGIS.Client.Map myMap2) { // This example shows how to draw Markers (aka. Points) on a FeatureLayer using the ClassBreaksRenderer // Class. This example takes two Map controls as arguments to compare the effect of applying a // ClassBreaksRenderer. Map1 will show a basic FeatureLayer that comes by default from ArcGIS Server. // Map2 will show the same FeatureLayer but with a specific ClassBreaksRenderer applied, to // compare the differences. // --------------------------------------------------------------------------------------------------------------------- // Clear the Layers in the Map's for runs of the function. myMap1.Layers.Clear(); myMap2.Layers.Clear(); // --------------------------------------------------------------------------------------------------------------------- // Display the default FeatureLayer in myMap1 // ========================================== // Add an ArcGISTiledMapsServiceLayer as a background to the map. Note: The first Layer added to the Map's // Layers Collection is on the bottom and the other Layer is added on the top. ESRI.ArcGIS.Client.ArcGISTiledMapServiceLayer myArcGISTiledMapServiceLayer1 = new ESRI.ArcGIS.Client.ArcGISTiledMapServiceLayer(); myArcGISTiledMapServiceLayer1.Url = "http://services.arcgisonline.com/ArcGIS/rest/services/ESRI_StreetMap_World_2D/MapServer"; myMap1.Layers.Add(myArcGISTiledMapServiceLayer1); // Add a FeatureLayer to the map. Note: This Layer is drawn on top of the background layer. ESRI.ArcGIS.Client.FeatureLayer myFeatureLayer1 = new ESRI.ArcGIS.Client.FeatureLayer(); // This FeatureLayer contains United States cities as Markers (aka. Points). myFeatureLayer1.Url = "http://sampleserver1.arcgisonline.com/ArcGIS/rest/services/Specialty/ESRI_StatesCitiesRivers_USA/MapServer/0"; // The Where clause is optional. It is necessary when more that 500/1000 records returned. In ArcGIS Server // 9.3.1 and prior, the default maximum is 500 records returned per FeatureLayer. In ArcGIS Server 10 the // default is 1000. This setting is configurable per map service using ArcCatalog or ArcGIS Server Manager // (on the Parameters tab). myFeatureLayer1.Where = "POP1990 > 100000"; // Add the myFeatureLayer1 to the Map1 Layer Collection. myMap1.Layers.Add(myFeatureLayer1); // Zoom to the continental United States. ESRI.ArcGIS.Client.Geometry.Envelope myEnvelope1 = new ESRI.ArcGIS.Client.Geometry.Envelope(); myEnvelope1.XMin = -130; myEnvelope1.YMin = 10; myEnvelope1.XMax = -70; myEnvelope1.YMax = 60; myMap1.Extent = myEnvelope1; // ----------------------------------------------------------------------------------------------------------------------- // Display the FeatureLayer in myMap2 that has a ClassBreaksRenderer applied // ========================================================================= // Add an ArcGISTiledMapsServiceLayer as a background to the map. Note: The first Layer added to the Map's // Layers Collection is on the bottom and the other Layer is added on the top. ESRI.ArcGIS.Client.ArcGISTiledMapServiceLayer myArcGISTiledMapServiceLayer2 = new ESRI.ArcGIS.Client.ArcGISTiledMapServiceLayer(); myArcGISTiledMapServiceLayer2.Url = "http://services.arcgisonline.com/ArcGIS/rest/services/ESRI_StreetMap_World_2D/MapServer"; myMap2.Layers.Add(myArcGISTiledMapServiceLayer2); // Add a FeatureLayer to the map. Note: This Layer is drawn on top of the background layer. ESRI.ArcGIS.Client.FeatureLayer myFeatureLayer2 = new ESRI.ArcGIS.Client.FeatureLayer(); // This FeatureLayer contains United States cities as Markers (aka. Points). myFeatureLayer2.Url = "http://sampleserver1.arcgisonline.com/ArcGIS/rest/services/Specialty/ESRI_StatesCitiesRivers_USA/MapServer/0"; // The Where clause is optional. It is necessary when more that 500/1000 records returned. In ArcGIS Server // 9.3.1 and prior, the default maximum is 500 records returned per FeatureLayer. In ArcGIS Server 10 the // default is 1000. This setting is configurable per map service using ArcCatalog or ArcGIS Server Manager // (on the Parameters tab). myFeatureLayer2.Where = "POP1990 > 100000"; // Specify the Outfields Property to specify which Fields are returned on which the // ClassBreaksRenderer.Field can use. Specifying the wildcard (*) character in the Add Property will // return all Fields. myFeatureLayer2.OutFields.Add("POP1990"); // Create the ClassBreakRenderer. ESRI.ArcGIS.Client.ClassBreaksRenderer myClassBreaksRenderer = new ESRI.ArcGIS.Client.ClassBreaksRenderer(); // Specify which Field (via its string name) the ClassBreaksRenderer will use for breaking the rendering // of the Symbols into groups. Note: The Field that is specified for the Field Property MUST be a // numeric (Double, Integer, SmallInteger, or Single) Field.FieldType. To Render groups of Strings use // the UniqueValueRenderer instead. myClassBreaksRenderer.Field = "POP1990"; // Requires a numeric Field // Define a default SimpleMarkerSymbol for a 'catch all' to draw the features for which no ClassBreaksInfo // has been defined. In this example, only cities with a population (POP1990) from 20,000 to 100,000,000 // have a defined ClassBreakInfo category and yet all cities with a population greater than 100,000 will // be returned. Defining a default SimpleMarkerSymbol will provide symbology for those features that are // greater than 100,000 but less than 200,000. If a ClassBreaksRenderer.DefaultSymbol was not defined // these features would not be drawn on the Map. ESRI.ArcGIS.Client.Symbols.SimpleMarkerSymbol defaultSimpleMarkerSymbol = new ESRI.ArcGIS.Client.Symbols.SimpleMarkerSymbol(); System.Windows.Media.SolidColorBrush defaultBrush = new System.Windows.Media.SolidColorBrush(Color.FromArgb(255, 255, 0, 0)); //Red defaultSimpleMarkerSymbol.Color = defaultBrush; defaultSimpleMarkerSymbol.Size = 3; myClassBreaksRenderer.DefaultSymbol = defaultSimpleMarkerSymbol; // NOTE: By default if no .Style is specified the is specified for a SimpleMarkerSymbol the // ESRI.ArcGIS.Client.Symbols.SimpleMarkerSymbol.SimpleMarkerStyle.Circle is set. // A ClassBreaksRenderer should have 2 or more ClassBreakInfo Classes (meaning classification or grouping) // to delineate the different symbology and class break information. The next three sections of code // define 3 different ClassBreakInfo Classes (or groups) and their associated symbology. // Group #1 // ======== // Create a ClassBreakInfo object as a container of information for each group. ESRI.ArcGIS.Client.ClassBreakInfo myClassBreakInfo1 = new ESRI.ArcGIS.Client.ClassBreakInfo(); // Define the minimum and maximum values for the numeric grouping of the Field defined as the // ClassBreaksRenderer.Field. myClassBreakInfo1.MinimumValue = 200000; myClassBreakInfo1.MaximumValue = 300000; // Add an informational description and label for the group. myClassBreakInfo1.Description = "200K to 300K people"; myClassBreakInfo1.Label = "A cyan circle size 6"; // Each ClassBreakInfo grouping needs a symbol to display ESRI.ArcGIS.Client.Symbols.SimpleMarkerSymbol mySimpleMarkerSymbol1 = new ESRI.ArcGIS.Client.Symbols.SimpleMarkerSymbol(); System.Windows.Media.SolidColorBrush myBrush1 = new System.Windows.Media.SolidColorBrush(Color.FromArgb(255, 0, 255, 255)); //Cyan mySimpleMarkerSymbol1.Color = myBrush1; mySimpleMarkerSymbol1.Size = 6; myClassBreakInfo1.Symbol = mySimpleMarkerSymbol1; // Add the ClassBreaksInfo information to the Classes (grouping) of the ClassBreaksRenderer myClassBreaksRenderer.Classes.Add(myClassBreakInfo1); // Group #2 // ======== // Create a ClassBreakInfo object as a container of information for each group. ESRI.ArcGIS.Client.ClassBreakInfo myClassBreakInfo2 = new ESRI.ArcGIS.Client.ClassBreakInfo(); // Define the minimum and maximum values for the numeric grouping of the Field defined as the // ClassBreaksRenderer.Field. myClassBreakInfo2.MinimumValue = 300000; myClassBreakInfo2.MaximumValue = 750000; // Add an informational description and label for the group. myClassBreakInfo2.Description = "300K to 750 people"; myClassBreakInfo2.Label = "An olive triangle size 10"; // Each ClassBreakInfo grouping needs a symbol to display. In this case the SimpleMarkerSymbol Style // was specified to be a Triangle (rather than the default Circle). ESRI.ArcGIS.Client.Symbols.SimpleMarkerSymbol mySimpleMarkerSymbol2 = new ESRI.ArcGIS.Client.Symbols.SimpleMarkerSymbol(); System.Windows.Media.SolidColorBrush myBrush2 = new System.Windows.Media.SolidColorBrush(Color.FromArgb(255, 107, 142, 35)); // Olive mySimpleMarkerSymbol2.Color = myBrush2; mySimpleMarkerSymbol2.Size = 10; mySimpleMarkerSymbol2.Style = ESRI.ArcGIS.Client.Symbols.SimpleMarkerSymbol.SimpleMarkerStyle.Triangle; myClassBreakInfo2.Symbol = mySimpleMarkerSymbol2; // Add the ClassBreaksInfo information to the Classes (grouping) of the ClassBreaksRenderer myClassBreaksRenderer.Classes.Add(myClassBreakInfo2); // Group #3 // ======== // Create a ClassBreakInfo object as a container of information for each group. ESRI.ArcGIS.Client.ClassBreakInfo myClassBreakInfo3 = new ESRI.ArcGIS.Client.ClassBreakInfo(); // Define the minimum and maximum values for the numeric grouping of the Field defined as the // ClassBreaksRenderer.Field. myClassBreakInfo3.MinimumValue = 750000; myClassBreakInfo3.MaximumValue = 100000000; // Add an informational description and label for the group. myClassBreakInfo3.Description = "750K to 100M people"; myClassBreakInfo3.Label = "A black square size 14"; // Each ClassBreakInfo grouping needs a symbol to display. In this case the SimpleMarkerSymbol Style // was specified to be a Square (rather than the default Circle). ESRI.ArcGIS.Client.Symbols.SimpleMarkerSymbol mySimpleMarkerSymbol3 = new ESRI.ArcGIS.Client.Symbols.SimpleMarkerSymbol(); System.Windows.Media.SolidColorBrush myBrush3 = new System.Windows.Media.SolidColorBrush(Color.FromArgb(255, 0, 0, 0)); //BLACK mySimpleMarkerSymbol3.Color = myBrush3; mySimpleMarkerSymbol3.Size = 14; mySimpleMarkerSymbol3.Style = ESRI.ArcGIS.Client.Symbols.SimpleMarkerSymbol.SimpleMarkerStyle.Square; myClassBreakInfo3.Symbol = mySimpleMarkerSymbol3; // Add the ClassBreaksInfo information to the Classes (grouping) of the ClassBreaksRenderer myClassBreaksRenderer.Classes.Add(myClassBreakInfo3); // Now that all of the ClassBreakInfo information has been added to the ClassBreaksRenderer object, // associate the ClassBreaksRenderer with the FeatuerLayer.Renderer Property. myFeatureLayer2.Renderer = myClassBreaksRenderer; // Add the myFeatureLayer2 to the Map2 Layer Collection. Map2.Layers.Add(myFeatureLayer2); // Zoom to the continental United States. ESRI.ArcGIS.Client.Geometry.Envelope myEnvelope2 = new ESRI.ArcGIS.Client.Geometry.Envelope(); myEnvelope2.XMin = -130; myEnvelope2.YMin = 10; myEnvelope2.XMax = -70; myEnvelope2.YMax = 60; Map2.Extent = myEnvelope2; } public void LineClassBreaksRenderer(ESRI.ArcGIS.Client.Map myMap1, ESRI.ArcGIS.Client.Map myMap2) { // This example shows how to draw Lines (aka. Polylines) on a FeatureLayer using the ClassBreaksRenderer // Class. This example takes two Map controls as arguments to compare the effect of applying a // ClassBreaksRenderer. Map1 will show a basic FeatureLayer that comes by default from ArcGIS Server. // Map2 will show the same FeatureLayer but with a specific ClassBreaksRenderer applied, to // compare the differences. // --------------------------------------------------------------------------------------------------------------------- // Clear the Layers in the Map's for runs of the function. myMap1.Layers.Clear(); myMap2.Layers.Clear(); // --------------------------------------------------------------------------------------------------------------------- // Display the default FeatureLayer in myMap1 // ========================================== // Add an ArcGISTiledMapsServiceLayer as a background to the map. Note: The first Layer added to the Map's // Layers Collection is on the bottom and the other Layer is added on the top. ESRI.ArcGIS.Client.ArcGISTiledMapServiceLayer myArcGISTiledMapServiceLayer1 = new ESRI.ArcGIS.Client.ArcGISTiledMapServiceLayer(); myArcGISTiledMapServiceLayer1.Url = "http://services.arcgisonline.com/ArcGIS/rest/services/ESRI_StreetMap_World_2D/MapServer"; myMap1.Layers.Add(myArcGISTiledMapServiceLayer1); // Add a FeatureLayer to the map. Note: This Layer is drawn on top of the background layer. ESRI.ArcGIS.Client.FeatureLayer myFeatureLayer1 = new ESRI.ArcGIS.Client.FeatureLayer(); // This FeatureLayer contains United States Interstate roads as Lines (aka. Polylines). myFeatureLayer1.Url = "http://sampleserver1.arcgisonline.com/ArcGIS/rest/services/Specialty/ESRI_StateCityHighway_USA/MapServer/0"; // The Where clause is optional. It is necessary when more that 500/1000 records returned. In ArcGIS Server // 9.3.1 and prior, the default maximum is 500 records returned per FeatureLayer. In ArcGIS Server 10 the // default is 1000. This setting is configurable per map service using ArcCatalog or ArcGIS Server Manager // (on the Parameters tab). myFeatureLayer1.Where = "ADMN_Class='Interstate'"; // Add the myFeatureLayer1 to the Map1 Layer Collection. myMap1.Layers.Add(myFeatureLayer1); // Zoom to the continental United States. ESRI.ArcGIS.Client.Geometry.Envelope myEnvelope1 = new ESRI.ArcGIS.Client.Geometry.Envelope(); myEnvelope1.XMin = -130; myEnvelope1.YMin = 10; myEnvelope1.XMax = -70; myEnvelope1.YMax = 60; myMap1.Extent = myEnvelope1; // ----------------------------------------------------------------------------------------------------------------------- // Display the FeatureLayer in myMap2 that has a ClassBreaksRenderer applied // ========================================================================= // Add an ArcGISTiledMapsServiceLayer as a background to the map. Note: The first Layer added to the Map's // Layers Collection is on the bottom and the other Layer is added on the top. ESRI.ArcGIS.Client.ArcGISTiledMapServiceLayer myArcGISTiledMapServiceLayer2 = new ESRI.ArcGIS.Client.ArcGISTiledMapServiceLayer(); myArcGISTiledMapServiceLayer2.Url = "http://services.arcgisonline.com/ArcGIS/rest/services/ESRI_StreetMap_World_2D/MapServer"; myMap2.Layers.Add(myArcGISTiledMapServiceLayer2); // Add a FeatureLayer to the map. Note: This Layer is drawn on top of the background layer. ESRI.ArcGIS.Client.FeatureLayer myFeatureLayer2 = new ESRI.ArcGIS.Client.FeatureLayer(); // This FeatureLayer contains United States Interstate roads as Lines (aka. Polylines). myFeatureLayer2.Url = "http://sampleserver1.arcgisonline.com/ArcGIS/rest/services/Specialty/ESRI_StateCityHighway_USA/MapServer/0"; // The Where clause is optional. It is necessary when more that 500/1000 records returned. In ArcGIS Server // 9.3.1 and prior, the default maximum is 500 records returned per FeatureLayer. In ArcGIS Server 10 the // default is 1000. This setting is configurable per map service using ArcCatalog or ArcGIS Server Manager // (on the Parameters tab). myFeatureLayer2.Where = "ADMN_Class='Interstate'"; // Specify the Outfields Property to specify which Fields are returned on which the // ClassBreaksRenderer.Field can use. Specifying the wildcard (*) character in the Add Property will // return all Fields. myFeatureLayer2.OutFields.Add("LENGTH"); // Create the ClassBreakRenderer. ESRI.ArcGIS.Client.ClassBreaksRenderer myClassBreaksRenderer = new ESRI.ArcGIS.Client.ClassBreaksRenderer(); // Specify which Field (via its string name) the ClassBreaksRenderer will use for breaking the rendering // of the Symbols into groups. Note: The Field that is specified for the Field Property MUST be a // numeric (Double, Integer, SmallInteger, or Single) Field.FieldType. To Render groups of Strings use // the UniqueValueRenderer instead. myClassBreaksRenderer.Field = "LENGTH"; // Requires a numeric Field // Define a default SimpleLineSymbol for a 'catch all' to draw the features for which no ClassBreaksInfo // has been defined. In this example, only Interstate roads with a road-length (LENGTH) from 50 to 1,000 // miles have a defined ClassBreakInfo category and yet all the Interstate roads will be returned (really // only the first 500 features are returned due to the ArcGIS Service configuration). Defining a default // SimpleLineSymbol will provide symbology for those features that have road lengths greater than 0 but // less than 50 miles long. If a ClassBreaksRenderer.DefaultSymbol was not defined these features would // not be drawn on the Map. ESRI.ArcGIS.Client.Symbols.SimpleLineSymbol defaultSimpleLineSymbol = new ESRI.ArcGIS.Client.Symbols.SimpleLineSymbol(); System.Windows.Media.SolidColorBrush defaultBrush = new System.Windows.Media.SolidColorBrush(Color.FromArgb(255, 255, 255, 0)); //Yellow defaultSimpleLineSymbol.Color = defaultBrush; defaultSimpleLineSymbol.Width = 5; myClassBreaksRenderer.DefaultSymbol = defaultSimpleLineSymbol; // NOTE: By default if no .LineStyle is specified the is specified for a SimpleLineSymbol the // ESRI.ArcGIS.Client.Symbols.SimpleLineSymbol.LineStyle.Solid is set. // A ClassBreaksRenderer should have 2 or more ClassBreakInfo Classes (meaning classification or grouping) // to delineate the different symbology and class break information. The next three sections of code // define 3 different ClassBreakInfo Classes (or groups) and their associated symbology. // Group #1 // ======== // Create a ClassBreakInfo object as a container of information for each group. ESRI.ArcGIS.Client.ClassBreakInfo myClassBreakInfo1 = new ESRI.ArcGIS.Client.ClassBreakInfo(); // Define the minimum and maximum values for the numeric grouping of the Field defined as the // ClassBreaksRenderer.Field. myClassBreakInfo1.MinimumValue = 50; myClassBreakInfo1.MaximumValue = 100; // Add an informational description and label for the group. myClassBreakInfo1.Description = "50 to 100 miles long"; myClassBreakInfo1.Label = "A cyan solid line, width 3"; // Each ClassBreakInfo grouping needs a symbol to display ESRI.ArcGIS.Client.Symbols.SimpleLineSymbol mySimpleLineSymbol1 = new ESRI.ArcGIS.Client.Symbols.SimpleLineSymbol(); System.Windows.Media.SolidColorBrush myBrush1 = new System.Windows.Media.SolidColorBrush(Color.FromArgb(255, 0, 255, 255)); //Cyan mySimpleLineSymbol1.Color = myBrush1; mySimpleLineSymbol1.Width = 3; myClassBreakInfo1.Symbol = mySimpleLineSymbol1; // Add the ClassBreaksInfo information to the Classes (grouping) of the ClassBreaksRenderer myClassBreaksRenderer.Classes.Add(myClassBreakInfo1); // Group #2 // ======== // Create a ClassBreakInfo object as a container of information for each group. ESRI.ArcGIS.Client.ClassBreakInfo myClassBreakInfo2 = new ESRI.ArcGIS.Client.ClassBreakInfo(); // Define the minimum and maximum values for the numeric grouping of the Field defined as the // ClassBreaksRenderer.Field. myClassBreakInfo2.MinimumValue = 100; myClassBreakInfo2.MaximumValue = 200; // Add an informational description and label for the group. myClassBreakInfo2.Description = "100 to 200 miles long"; myClassBreakInfo2.Label = "An olive dash line, width 1"; // Each ClassBreakInfo grouping needs a symbol to display. In this case the SimpleLineSymbol LineStyle // was specified to be a Dash (rather than the default Solid). ESRI.ArcGIS.Client.Symbols.SimpleLineSymbol mySimpleLineSymbol2 = new ESRI.ArcGIS.Client.Symbols.SimpleLineSymbol(); System.Windows.Media.SolidColorBrush myBrush2 = new System.Windows.Media.SolidColorBrush(Color.FromArgb(255, 107, 142, 35)); // Olive mySimpleLineSymbol2.Color = myBrush2; mySimpleLineSymbol2.Width = 1; mySimpleLineSymbol2.Style = ESRI.ArcGIS.Client.Symbols.SimpleLineSymbol.LineStyle.Dash; myClassBreakInfo2.Symbol = mySimpleLineSymbol2; // Add the ClassBreaksInfo information to the Classes (grouping) of the ClassBreaksRenderer myClassBreaksRenderer.Classes.Add(myClassBreakInfo2); // Group #3 // ======== // Create a ClassBreakInfo object as a container of information for each group. ESRI.ArcGIS.Client.ClassBreakInfo myClassBreakInfo3 = new ESRI.ArcGIS.Client.ClassBreakInfo(); // Define the minimum and maximum values for the numeric grouping of the Field defined as the // ClassBreaksRenderer.Field. myClassBreakInfo3.MinimumValue = 200; myClassBreakInfo3.MaximumValue = 1000; // Add an informational description and label for the group. myClassBreakInfo3.Description = "200 to 1000 miles long"; myClassBreakInfo3.Label = "A black dot line, width 2"; // Each ClassBreakInfo grouping needs a symbol to display. In this case the SimpleLineSymbol LineStyle // was specified to be a Dot (rather than the default Solid). ESRI.ArcGIS.Client.Symbols.SimpleLineSymbol mySimpleLineSymbol3 = new ESRI.ArcGIS.Client.Symbols.SimpleLineSymbol(); System.Windows.Media.SolidColorBrush myBrush3 = new System.Windows.Media.SolidColorBrush(Color.FromArgb(255, 0, 0, 0)); //Black mySimpleLineSymbol3.Color = myBrush3; mySimpleLineSymbol3.Width = 2; mySimpleLineSymbol3.Style = ESRI.ArcGIS.Client.Symbols.SimpleLineSymbol.LineStyle.Dot; myClassBreakInfo3.Symbol = mySimpleLineSymbol3; // Add the ClassBreaksInfo information to the Classes (grouping) of the ClassBreaksRenderer myClassBreaksRenderer.Classes.Add(myClassBreakInfo3); // Now that all of the ClassBreakInfo information has been added to the ClassBreaksRenderer object, // associate the ClassBreaksRenderer with the FeatuerLayer.Renderer Property. myFeatureLayer2.Renderer = myClassBreaksRenderer; // Add the myFeatureLayer2 to the Map2 Layer Collection. Map2.Layers.Add(myFeatureLayer2); // Zoom to the continental United States. ESRI.ArcGIS.Client.Geometry.Envelope myEnvelope2 = new ESRI.ArcGIS.Client.Geometry.Envelope(); myEnvelope2.XMin = -130; myEnvelope2.YMin = 10; myEnvelope2.XMax = -70; myEnvelope2.YMax = 60; Map2.Extent = myEnvelope2; } public void FillClassBreaksRenderer(ESRI.ArcGIS.Client.Map myMap1, ESRI.ArcGIS.Client.Map myMap2) { // This example shows how to draw Fills (aka. Polygons) on a FeatureLayer using the ClassBreaksRenderer // Class. This example takes two Map controls as arguments to compare the effect of applying a // ClassBreaksRenderer. Map1 will show a basic FeatureLayer that comes by default from ArcGIS Server. // Map2 will show the same FeatureLayer but with a specific ClassBreaksRenderer applied, to // compare the differences. // --------------------------------------------------------------------------------------------------------------------- // Clear the Layers in the Map's for runs of the function. myMap1.Layers.Clear(); myMap2.Layers.Clear(); // --------------------------------------------------------------------------------------------------------------------- // Display the default FeatureLayer in myMap1 // ========================================== // Add an ArcGISTiledMapsServiceLayer as a background to the map. Note: The first Layer added to the Map's // Layers Collection is on the bottom and the other Layer is added on the top. ESRI.ArcGIS.Client.ArcGISTiledMapServiceLayer myArcGISTiledMapServiceLayer1 = new ESRI.ArcGIS.Client.ArcGISTiledMapServiceLayer(); myArcGISTiledMapServiceLayer1.Url = "http://services.arcgisonline.com/ArcGIS/rest/services/ESRI_StreetMap_World_2D/MapServer"; myMap1.Layers.Add(myArcGISTiledMapServiceLayer1); // Add a FeatureLayer to the map. Note: This Layer is drawn on top of the background layer. ESRI.ArcGIS.Client.FeatureLayer myFeatureLayer1 = new ESRI.ArcGIS.Client.FeatureLayer(); // This FeatureLayer contains US states as Fills (aka. Polygons). myFeatureLayer1.Url = "http://sampleserver1.arcgisonline.com/ArcGIS/rest/services/Specialty/ESRI_StatesCitiesRivers_USA/MapServer/2"; // The Where clause is optional. It is necessary when more that 500/1000 records returned. In ArcGIS Server // 9.3.1 and prior, the default maximum is 500 records returned per FeatureLayer. In ArcGIS Server 10 the // default is 1000. This setting is configurable per map service using ArcCatalog or ArcGIS Server Manager // (on the Parameters tab). myFeatureLayer1.Where = "1=1"; // Tip: The syntax "1=1" returns all records! // Add the myFeatureLayer1 to the Map1 Layer Collection. myMap1.Layers.Add(myFeatureLayer1); // Zoom to the continental United States. ESRI.ArcGIS.Client.Geometry.Envelope myEnvelope1 = new ESRI.ArcGIS.Client.Geometry.Envelope(); myEnvelope1.XMin = -130; myEnvelope1.YMin = 10; myEnvelope1.XMax = -70; myEnvelope1.YMax = 60; myMap1.Extent = myEnvelope1; // ----------------------------------------------------------------------------------------------------------------------- // Display the FeatureLayer in myMap2 that has a ClassBreaksRenderer applied // ========================================================================= // Add an ArcGISTiledMapsServiceLayer as a background to the map. Note: The first Layer added to the Map's // Layers Collection is on the bottom and the other Layer is added on the top. ESRI.ArcGIS.Client.ArcGISTiledMapServiceLayer myArcGISTiledMapServiceLayer2 = new ESRI.ArcGIS.Client.ArcGISTiledMapServiceLayer(); myArcGISTiledMapServiceLayer2.Url = "http://services.arcgisonline.com/ArcGIS/rest/services/ESRI_StreetMap_World_2D/MapServer"; myMap2.Layers.Add(myArcGISTiledMapServiceLayer2); // Add a FeatureLayer to the map. Note: This Layer is drawn on top of the background layer. ESRI.ArcGIS.Client.FeatureLayer myFeatureLayer2 = new ESRI.ArcGIS.Client.FeatureLayer(); // This FeatureLayer contains US states as Fills (aka. Polygons). myFeatureLayer2.Url = "http://sampleserver1.arcgisonline.com/ArcGIS/rest/services/Specialty/ESRI_StatesCitiesRivers_USA/MapServer/2"; // The Where clause is optional. It is necessary when more that 500/1000 records returned. In ArcGIS Server // 9.3.1 and prior, the default maximum is 500 records returned per FeatureLayer. In ArcGIS Server 10 the // default is 1000. This setting is configurable per map service using ArcCatalog or ArcGIS Server Manager // (on the Parameters tab). myFeatureLayer2.Where = "1=1"; // Tip: The syntax "1=1" returns all records! // Specify the Outfields Property to specify which Fields are returned on which the // ClassBreaksRenderer.Field can use. Specifying the wildcard (*) character in the Add Property will // return all Fields. myFeatureLayer2.OutFields.Add("*"); // Create the ClassBreakRenderer. ESRI.ArcGIS.Client.ClassBreaksRenderer myClassBreaksRenderer = new ESRI.ArcGIS.Client.ClassBreaksRenderer(); // Specify which Field (via its string name) the ClassBreaksRenderer will use for breaking the rendering // of the Symbols into groups. Note: The Field that is specified for the Field Property MUST be a // numeric (Double, Integer, SmallInteger, or Single) Field.FieldType. To Render groups of Strings use // the UniqueValueRenderer instead. myClassBreaksRenderer.Field = "POP1990"; // Requires a numeric Field // Define a default SimpleFillSymbol for a 'catch all' to draw the features for which no ClassBreaksInfo // has been defined. In this example, only states with a population (POP1990) from 1,000,000 to 100,000,000 // persons have a defined ClassBreakInfo category and yet all states will be returned. Defining a default // SimpleFillSymbol will provide symbology for those features that are greater than 0 but less than // 1,000,000. If a ClassBreaksRenderer.DefaultSymbol was not defined these features would not be drawn on // the Map. ESRI.ArcGIS.Client.Symbols.SimpleFillSymbol defaultSimpleFillSymbol = new ESRI.ArcGIS.Client.Symbols.SimpleFillSymbol(); System.Windows.Media.SolidColorBrush defaultBrush = new System.Windows.Media.SolidColorBrush(Color.FromArgb(255, 255, 255, 0)); //Yellow defaultSimpleFillSymbol.Fill = defaultBrush; myClassBreaksRenderer.DefaultSymbol = defaultSimpleFillSymbol; // A ClassBreaksRenderer should have 2 or more ClassBreakInfo Classes (meaning classification or grouping) // to delineate the different symbology and class break information. The next three sections of code // define 3 different ClassBreakInfo Classes (or groups) and their associated symbology. // Group #1 // ======== // Create a ClassBreakInfo object as a container of information for each group. ESRI.ArcGIS.Client.ClassBreakInfo myClassBreakInfo1 = new ESRI.ArcGIS.Client.ClassBreakInfo(); // Define the minimum and maximum values for the numeric grouping of the Field defined as the // ClassBreaksRenderer.Field. myClassBreakInfo1.MinimumValue = 1000000; myClassBreakInfo1.MaximumValue = 3000000; // Add an informational description and label for the group. myClassBreakInfo1.Description = "1M to 3M people"; myClassBreakInfo1.Label = "A cyan solid fill"; // Each ClassBreakInfo grouping needs a symbol to display ESRI.ArcGIS.Client.Symbols.SimpleFillSymbol mySimpleFillSymbol1 = new ESRI.ArcGIS.Client.Symbols.SimpleFillSymbol(); System.Windows.Media.SolidColorBrush myBrush1 = new System.Windows.Media.SolidColorBrush(Color.FromArgb(255, 0, 255, 255)); //Cyan mySimpleFillSymbol1.Fill = myBrush1; myClassBreakInfo1.Symbol = mySimpleFillSymbol1; // Add the ClassBreaksInfo information to the Classes (grouping) of the ClassBreaksRenderer myClassBreaksRenderer.Classes.Add(myClassBreakInfo1); // Group #2 // ======== // Create a ClassBreakInfo object as a container of information for each group. ESRI.ArcGIS.Client.ClassBreakInfo myClassBreakInfo2 = new ESRI.ArcGIS.Client.ClassBreakInfo(); // Define the minimum and maximum values for the numeric grouping of the Field defined as the // ClassBreaksRenderer.Field. myClassBreakInfo2.MinimumValue = 3000000; myClassBreakInfo2.MaximumValue = 10000000; // Add an informational description and label for the group. myClassBreakInfo2.Description = "3M to 10M people"; myClassBreakInfo2.Label = "An olive solid fill"; // Each ClassBreakInfo grouping needs a symbol to display. ESRI.ArcGIS.Client.Symbols.SimpleFillSymbol mySimpleFillSymbol2 = new ESRI.ArcGIS.Client.Symbols.SimpleFillSymbol(); System.Windows.Media.SolidColorBrush myBrush2 = new System.Windows.Media.SolidColorBrush(Color.FromArgb(255, 107, 142, 35)); // Olive mySimpleFillSymbol2.Fill = myBrush2; myClassBreakInfo2.Symbol = mySimpleFillSymbol2; // Add the ClassBreaksInfo information to the Classes (grouping) of the ClassBreaksRenderer myClassBreaksRenderer.Classes.Add(myClassBreakInfo2); // Group #3 // ======== // Create a ClassBreakInfo object as a container of information for each group. ESRI.ArcGIS.Client.ClassBreakInfo myClassBreakInfo3 = new ESRI.ArcGIS.Client.ClassBreakInfo(); // Define the minimum and maximum values for the numeric grouping of the Field defined as the // ClassBreaksRenderer.Field. myClassBreakInfo3.MinimumValue = 10000000; myClassBreakInfo3.MaximumValue = 100000000; // Add an informational description and label for the group. myClassBreakInfo3.Description = "10M to 100M people"; myClassBreakInfo3.Label = "A black solid fill"; // Each ClassBreakInfo grouping needs a symbol to display. ESRI.ArcGIS.Client.Symbols.SimpleFillSymbol mySimpleFillSymbol3 = new ESRI.ArcGIS.Client.Symbols.SimpleFillSymbol(); System.Windows.Media.SolidColorBrush myBrush3 = new System.Windows.Media.SolidColorBrush(Color.FromArgb(255, 0, 0, 0)); //BLACK mySimpleFillSymbol3.Fill = myBrush3; myClassBreakInfo3.Symbol = mySimpleFillSymbol3; // Add the ClassBreaksInfo information to the Classes (grouping) of the ClassBreaksRenderer myClassBreaksRenderer.Classes.Add(myClassBreakInfo3); // Now that all of the ClassBreakInfo information has been added to the ClassBreaksRenderer object, // associate the ClassBreaksRenderer with the FeatuerLayer.Renderer Property. myFeatureLayer2.Renderer = myClassBreaksRenderer; // Add the myFeatureLayer2 to the Map2 Layer Collection. Map2.Layers.Add(myFeatureLayer2); // Zoom to the continental United States. ESRI.ArcGIS.Client.Geometry.Envelope myEnvelope2 = new ESRI.ArcGIS.Client.Geometry.Envelope(); myEnvelope2.XMin = -130; myEnvelope2.YMin = 10; myEnvelope2.XMax = -70; myEnvelope2.YMax = 60; Map2.Extent = myEnvelope2; } | |
| VB.NET | Copy Code |
|---|---|
Public Sub MarkerClassBreaksRenderer(ByVal myMap1 As ESRI.ArcGIS.Client.Map, ByVal myMap2 As ESRI.ArcGIS.Client.Map) ' This example shows how to draw Markers (aka. Points) on a FeatureLayer using the ClassBreaksRenderer ' Class. This example takes two Map controls as arguments to compare the effect of applying a ' ClassBreaksRenderer. Map1 will show a basic FeatureLayer that comes by default from ArcGIS Server. ' Map2 will show the same FeatureLayer but with a specific ClassBreaksRenderer applied, to ' compare the differences. ' --------------------------------------------------------------------------------------------------------------------- ' Clear the Layers in the Map's for runs of the function. myMap1.Layers.Clear() myMap2.Layers.Clear() ' --------------------------------------------------------------------------------------------------------------------- ' Display the default FeatureLayer in myMap1 ' ========================================== ' Add an ArcGISTiledMapsServiceLayer as a background to the map. Note: The first Layer added to the Map's ' Layers Collection is on the bottom and the other Layer is added on the top. Dim myArcGISTiledMapServiceLayer1 As New ESRI.ArcGIS.Client.ArcGISTiledMapServiceLayer myArcGISTiledMapServiceLayer1.Url = "http://services.arcgisonline.com/ArcGIS/rest/services/ESRI_StreetMap_World_2D/MapServer" myMap1.Layers.Add(myArcGISTiledMapServiceLayer1) ' Add a FeatureLayer to the map. Note: This Layer is drawn on top of the background layer. Dim myFeatureLayer1 As New ESRI.ArcGIS.Client.FeatureLayer ' This FeatureLayer contains United States cities as Markers (aka. Points). myFeatureLayer1.Url = "http://sampleserver1.arcgisonline.com/ArcGIS/rest/services/Specialty/ESRI_StatesCitiesRivers_USA/MapServer/0" ' The Where clause is optional. It is necessary when more that 500/1000 records returned. In ArcGIS Server ' 9.3.1 and prior, the default maximum is 500 records returned per FeatureLayer. In ArcGIS Server 10 the ' default is 1000. This setting is configurable per map service using ArcCatalog or ArcGIS Server Manager ' (on the Parameters tab). myFeatureLayer1.Where = "POP1990 > 100000" ' Add the myFeatureLayer1 to the Map1 Layer Collection. myMap1.Layers.Add(myFeatureLayer1) ' Zoom to the continental United States. Dim myEnvelope1 As New ESRI.ArcGIS.Client.Geometry.Envelope myEnvelope1.XMin = -130 myEnvelope1.YMin = 10 myEnvelope1.XMax = -70 myEnvelope1.YMax = 60 myMap1.Extent = myEnvelope1 ' ----------------------------------------------------------------------------------------------------------------------- ' Display the FeatureLayer in myMap2 that has a ClassBreaksRenderer applied ' ========================================================================= ' Add an ArcGISTiledMapsServiceLayer as a background to the map. Note: The first Layer added to the Map's ' Layers Collection is on the bottom and the other Layer is added on the top. Dim myArcGISTiledMapServiceLayer2 As New ESRI.ArcGIS.Client.ArcGISTiledMapServiceLayer myArcGISTiledMapServiceLayer2.Url = "http://services.arcgisonline.com/ArcGIS/rest/services/ESRI_StreetMap_World_2D/MapServer" myMap2.Layers.Add(myArcGISTiledMapServiceLayer2) ' Add a FeatureLayer to the map. Note: This Layer is drawn on top of the background layer. Dim myFeatureLayer2 As New ESRI.ArcGIS.Client.FeatureLayer ' This FeatureLayer contains United States cities as Markers (aka. Points). myFeatureLayer2.Url = "http://sampleserver1.arcgisonline.com/ArcGIS/rest/services/Specialty/ESRI_StatesCitiesRivers_USA/MapServer/0" ' The Where clause is optional. It is necessary when more that 500/1000 records returned. In ArcGIS Server ' 9.3.1 and prior, the default maximum is 500 records returned per FeatureLayer. In ArcGIS Server 10 the ' default is 1000. This setting is configurable per map service using ArcCatalog or ArcGIS Server Manager ' (on the Parameters tab). myFeatureLayer2.Where = "POP1990 > 100000" ' Specify the Outfields Property to specify which Fields are returned on which the ' ClassBreaksRenderer.Field can use. Specifying the wildcard (*) character in the Add Property will ' return all Fields. myFeatureLayer2.OutFields.Add("POP1990") ' Create the ClassBreakRenderer. Dim myClassBreaksRenderer As New ESRI.ArcGIS.Client.ClassBreaksRenderer ' Specify which Field (via its string name) the ClassBreaksRenderer will use for breaking the rendering ' of the Symbols into groups. Note: The Field that is specified for the Field Property MUST be a ' numeric (Double, Integer, SmallInteger, or Single) Field.FieldType. To Render groups of Strings use ' the UniqueValueRenderer instead. myClassBreaksRenderer.Field = "POP1990" ' Requires a numeric Field ' Define a default SimpleMarkerSymbol for a 'catch all' to draw the features for which no ClassBreaksInfo ' has been defined. In this example, only cities with a population (POP1990) from 20,000 to 100,000,000 ' have a defined ClassBreakInfo category and yet all cities with a population greater than 100,000 will ' be returned. Defining a default SimpleMarkerSymbol will provide symbology for those features that are ' greater than 100,000 but less than 200,000. If a ClassBreaksRenderer.DefaultSymbol was not defined ' these features would not be drawn on the Map. Dim defaultSimpleMarkerSymbol As New ESRI.ArcGIS.Client.Symbols.SimpleMarkerSymbol Dim defaultBrush As New System.Windows.Media.SolidColorBrush(Color.FromArgb(255, 255, 0, 0)) 'Red defaultSimpleMarkerSymbol.Color = defaultBrush defaultSimpleMarkerSymbol.Size = 3 ' Defining the size of the SimpleMarkerSymbol is optional. myClassBreaksRenderer.DefaultSymbol = defaultSimpleMarkerSymbol ' NOTE: By default if no .Style is specified the is specified for a SimpleMarkerSymbol the ' ESRI.ArcGIS.Client.Symbols.SimpleMarkerSymbol.SimpleMarkerStyle.Circle is set. ' A ClassBreaksRenderer should have 2 or more ClassBreakInfo Classes (meaning classification or grouping) ' to delineate the different symbology and class break information. The next three sections of code ' define 3 different ClassBreakInfo Classes (or groups) and their associated symbology. ' Group #1 ' ======== ' Create a ClassBreakInfo object as a container of information for each group. Dim myClassBreakInfo1 As New ESRI.ArcGIS.Client.ClassBreakInfo ' Define the minimum and maximum values for the numeric grouping of the Field defined as the ' ClassBreaksRenderer.Field. myClassBreakInfo1.MinimumValue = 200000 myClassBreakInfo1.MaximumValue = 300000 ' Add an informational description and label for the group. myClassBreakInfo1.Description = "200K to 300K people" myClassBreakInfo1.Label = "A cyan circle size 6" ' Each ClassBreakInfo grouping needs a symbol to display Dim mySimpleMarkerSymbol1 As New ESRI.ArcGIS.Client.Symbols.SimpleMarkerSymbol Dim myBrush1 As New System.Windows.Media.SolidColorBrush(Color.FromArgb(255, 0, 255, 255)) 'Cyan mySimpleMarkerSymbol1.Color = myBrush1 mySimpleMarkerSymbol1.Size = 6 myClassBreakInfo1.Symbol = mySimpleMarkerSymbol1 ' Add the ClassBreaksInfo information to the Classes (grouping) of the ClassBreaksRenderer myClassBreaksRenderer.Classes.Add(myClassBreakInfo1) ' Group #2 ' ======== ' Create a ClassBreakInfo object as a container of information for each group. Dim myClassBreakInfo2 As New ESRI.ArcGIS.Client.ClassBreakInfo ' Define the minimum and maximum values for the numeric grouping of the Field defined as the ' ClassBreaksRenderer.Field. myClassBreakInfo2.MinimumValue = 300000 myClassBreakInfo2.MaximumValue = 750000 ' Add an informational description and label for the group. myClassBreakInfo2.Description = "300K to 750 people" myClassBreakInfo2.Label = "An olive triangle size 10" ' Each ClassBreakInfo grouping needs a symbol to display. In this case the SimpleMarkerSymbol Style ' was specified to be a Triangle (rather than the default Circle). Dim mySimpleMarkerSymbol2 As New ESRI.ArcGIS.Client.Symbols.SimpleMarkerSymbol Dim myBrush2 As New System.Windows.Media.SolidColorBrush(Color.FromArgb(255, 107, 142, 35)) ' Olive mySimpleMarkerSymbol2.Color = myBrush2 mySimpleMarkerSymbol2.Size = 10 mySimpleMarkerSymbol2.Style = ESRI.ArcGIS.Client.Symbols.SimpleMarkerSymbol.SimpleMarkerStyle.Triangle myClassBreakInfo2.Symbol = mySimpleMarkerSymbol2 ' Add the ClassBreaksInfo information to the Classes (grouping) of the ClassBreaksRenderer myClassBreaksRenderer.Classes.Add(myClassBreakInfo2) ' Group #3 ' ======== ' Create a ClassBreakInfo object as a container of information for each group. Dim myClassBreakInfo3 As New ESRI.ArcGIS.Client.ClassBreakInfo ' Define the minimum and maximum values for the numeric grouping of the Field defined as the ' ClassBreaksRenderer.Field. myClassBreakInfo3.MinimumValue = 750000 myClassBreakInfo3.MaximumValue = 100000000 ' Add an informational description and label for the group. myClassBreakInfo3.Description = "750K to 100M people" myClassBreakInfo3.Label = "A black square size 14" ' Each ClassBreakInfo grouping needs a symbol to display. In this case the SimpleMarkerSymbol Style ' was specified to be a Square (rather than the default Circle). Dim mySimpleMarkerSymbol3 As New ESRI.ArcGIS.Client.Symbols.SimpleMarkerSymbol Dim myBrush3 As New System.Windows.Media.SolidColorBrush(Color.FromArgb(255, 0, 0, 0)) 'BLACK mySimpleMarkerSymbol3.Color = myBrush3 mySimpleMarkerSymbol3.Size = 14 mySimpleMarkerSymbol3.Style = ESRI.ArcGIS.Client.Symbols.SimpleMarkerSymbol.SimpleMarkerStyle.Square myClassBreakInfo3.Symbol = mySimpleMarkerSymbol3 ' Add the ClassBreaksInfo information to the Classes (grouping) of the ClassBreaksRenderer myClassBreaksRenderer.Classes.Add(myClassBreakInfo3) ' Now that all of the ClassBreakInfo information has been added to the ClassBreaksRenderer object, ' associate the ClassBreaksRenderer with the FeatuerLayer.Renderer Property. myFeatureLayer2.Renderer = myClassBreaksRenderer ' Add the myFeatureLayer2 to the Map2 Layer Collection. Map2.Layers.Add(myFeatureLayer2) ' Zoom to the continental United States. Dim myEnvelope2 As New ESRI.ArcGIS.Client.Geometry.Envelope myEnvelope2.XMin = -130 myEnvelope2.YMin = 10 myEnvelope2.XMax = -70 myEnvelope2.YMax = 60 Map2.Extent = myEnvelope2 End Sub Public Sub LineClassBreaksRenderer(ByVal myMap1 As ESRI.ArcGIS.Client.Map, ByVal myMap2 As ESRI.ArcGIS.Client.Map) ' This example shows how to draw Lines (aka. Polylines) on a FeatureLayer using the ClassBreaksRenderer ' Class. This example takes two Map controls as arguments to compare the effect of applying a ' ClassBreaksRenderer. Map1 will show a basic FeatureLayer that comes by default from ArcGIS Server. ' Map2 will show the same FeatureLayer but with a specific ClassBreaksRenderer applied, to ' compare the differences. ' --------------------------------------------------------------------------------------------------------------------- ' Clear the Layers in the Map's for runs of the function. myMap1.Layers.Clear() myMap2.Layers.Clear() ' --------------------------------------------------------------------------------------------------------------------- ' Display the default FeatureLayer in myMap1 ' ========================================== ' Add an ArcGISTiledMapsServiceLayer as a background to the map. Note: The first Layer added to the Map's ' Layers Collection is on the bottom and the other Layer is added on the top. Dim myArcGISTiledMapServiceLayer1 As New ESRI.ArcGIS.Client.ArcGISTiledMapServiceLayer myArcGISTiledMapServiceLayer1.Url = "http://services.arcgisonline.com/ArcGIS/rest/services/ESRI_StreetMap_World_2D/MapServer" myMap1.Layers.Add(myArcGISTiledMapServiceLayer1) ' Add a FeatureLayer to the map. Note: This Layer is drawn on top of the background layer. Dim myFeatureLayer1 As New ESRI.ArcGIS.Client.FeatureLayer ' This FeatureLayer contains United States Interstate roads as Lines (aka. Polylines). myFeatureLayer1.Url = "http://sampleserver1.arcgisonline.com/ArcGIS/rest/services/Specialty/ESRI_StateCityHighway_USA/MapServer/0" ' The Where clause is optional. It is necessary when more that 500/1000 records returned. In ArcGIS Server ' 9.3.1 and prior, the default maximum is 500 records returned per FeatureLayer. In ArcGIS Server 10 the ' default is 1000. This setting is configurable per map service using ArcCatalog or ArcGIS Server Manager ' (on the Parameters tab). myFeatureLayer1.Where = "ADMN_Class='Interstate'" ' Add the myFeatureLayer1 to the Map1 Layer Collection. myMap1.Layers.Add(myFeatureLayer1) ' Zoom to the continental United States. Dim myEnvelope1 As New ESRI.ArcGIS.Client.Geometry.Envelope myEnvelope1.XMin = -130 myEnvelope1.YMin = 10 myEnvelope1.XMax = -70 myEnvelope1.YMax = 60 myMap1.Extent = myEnvelope1 ' ----------------------------------------------------------------------------------------------------------------------- /// ' Display the FeatureLayer in myMap2 that has a ClassBreaksRenderer applied ' ========================================================================= ' Add an ArcGISTiledMapsServiceLayer as a background to the map. Note: The first Layer added to the Map's ' Layers Collection is on the bottom and the other Layer is added on the top. Dim myArcGISTiledMapServiceLayer2 As New ESRI.ArcGIS.Client.ArcGISTiledMapServiceLayer myArcGISTiledMapServiceLayer2.Url = "http://services.arcgisonline.com/ArcGIS/rest/services/ESRI_StreetMap_World_2D/MapServer" myMap2.Layers.Add(myArcGISTiledMapServiceLayer2) ' Add a FeatureLayer to the map. Note: This Layer is drawn on top of the background layer. Dim myFeatureLayer2 As New ESRI.ArcGIS.Client.FeatureLayer ' This FeatureLayer contains United States Interstate roads as Lines (aka. Polylines). myFeatureLayer2.Url = "http://sampleserver1.arcgisonline.com/ArcGIS/rest/services/Specialty/ESRI_StateCityHighway_USA/MapServer/0" ' The Where clause is optional. It is necessary when more that 500/1000 records returned. In ArcGIS Server ' 9.3.1 and prior, the default maximum is 500 records returned per FeatureLayer. In ArcGIS Server 10 the ' default is 1000. This setting is configurable per map service using ArcCatalog or ArcGIS Server Manager ' (on the Parameters tab). myFeatureLayer2.Where = "ADMN_Class='Interstate'" ' Specify the Outfields Property to specify which Fields are returned on which the ' ClassBreaksRenderer.Field can use. Specifying the wildcard (*) character in the Add Property will ' return all Fields. myFeatureLayer2.OutFields.Add("LENGTH") ' Create the ClassBreakRenderer. Dim myClassBreaksRenderer As New ESRI.ArcGIS.Client.ClassBreaksRenderer ' Specify which Field (via its string name) the ClassBreaksRenderer will use for breaking the rendering ' of the Symbols into groups. Note: The Field that is specified for the Field Property MUST be a ' numeric (Double, Integer, SmallInteger, or Single) Field.FieldType. To Render groups of Strings use ' the UniqueValueRenderer instead. myClassBreaksRenderer.Field = "LENGTH" ' Requires a numeric Field ' Define a default SimpleLineSymbol for a 'catch all' to draw the features for which no ClassBreaksInfo ' has been defined. In this example, only Interstate roads with a road-length (LENGTH) from 50 to 1,000 ' miles have a defined ClassBreakInfo category and yet all the Interstate roads will be returned (really ' only the first 500 features are returned due to the ArcGIS Service configuration). Defining a default ' SimpleLineSymbol will provide symbology for those features that have road lengths greater than 0 but ' less than 50 miles long. If a ClassBreaksRenderer.DefaultSymbol was not defined these features would ' not be drawn on the Map. Dim defaultSimpleLineSymbol As New ESRI.ArcGIS.Client.Symbols.SimpleLineSymbol Dim defaultBrush As New System.Windows.Media.SolidColorBrush(Color.FromArgb(255, 255, 255, 0)) 'Yellow defaultSimpleLineSymbol.Color = defaultBrush defaultSimpleLineSymbol.Width = 5 myClassBreaksRenderer.DefaultSymbol = defaultSimpleLineSymbol ' NOTE: By default if no .LineStyle is specified the is specified for a SimpleLineSymbol the ' ESRI.ArcGIS.Client.Symbols.SimpleLineSymbol.LineStyle.Solid is set. ' A ClassBreaksRenderer should have 2 or more ClassBreakInfo Classes (meaning classification or grouping) ' to delineate the different symbology and class break information. The next three sections of code ' define 3 different ClassBreakInfo Classes (or groups) and their associated symbology. ' Group #1 ' ======== ' Create a ClassBreakInfo object as a container of information for each group. Dim myClassBreakInfo1 As New ESRI.ArcGIS.Client.ClassBreakInfo ' Define the minimum and maximum values for the numeric grouping of the Field defined as the ' ClassBreaksRenderer.Field. myClassBreakInfo1.MinimumValue = 50 myClassBreakInfo1.MaximumValue = 100 ' Add an informational description and label for the group. myClassBreakInfo1.Description = "50 to 100 miles long" myClassBreakInfo1.Label = "A cyan solid line, width 3" ' Each ClassBreakInfo grouping needs a symbol to display Dim mySimpleLineSymbol1 As New ESRI.ArcGIS.Client.Symbols.SimpleLineSymbol Dim myBrush1 As New System.Windows.Media.SolidColorBrush(Color.FromArgb(255, 0, 255, 255)) 'Cyan mySimpleLineSymbol1.Color = myBrush1 mySimpleLineSymbol1.Width = 3 myClassBreakInfo1.Symbol = mySimpleLineSymbol1 ' Add the ClassBreaksInfo information to the Classes (grouping) of the ClassBreaksRenderer myClassBreaksRenderer.Classes.Add(myClassBreakInfo1) ' Group #2 ' ======== ' Create a ClassBreakInfo object as a container of information for each group. Dim myClassBreakInfo2 As New ESRI.ArcGIS.Client.ClassBreakInfo ' Define the minimum and maximum values for the numeric grouping of the Field defined as the ' ClassBreaksRenderer.Field. myClassBreakInfo2.MinimumValue = 100 myClassBreakInfo2.MaximumValue = 200 ' Add an informational description and label for the group. myClassBreakInfo2.Description = "100 to 200 miles long" myClassBreakInfo2.Label = "An olive dash line, width 1" ' Each ClassBreakInfo grouping needs a symbol to display. In this case the SimpleLineSymbol LineStyle ' was specified to be a Dash (rather than the default Solid). Dim mySimpleLineSymbol2 As New ESRI.ArcGIS.Client.Symbols.SimpleLineSymbol Dim myBrush2 As New System.Windows.Media.SolidColorBrush(Color.FromArgb(255, 107, 142, 35)) ' Olive mySimpleLineSymbol2.Color = myBrush2 mySimpleLineSymbol2.Width = 1 mySimpleLineSymbol2.Style = ESRI.ArcGIS.Client.Symbols.SimpleLineSymbol.LineStyle.Dash myClassBreakInfo2.Symbol = mySimpleLineSymbol2 ' Add the ClassBreaksInfo information to the Classes (grouping) of the ClassBreaksRenderer myClassBreaksRenderer.Classes.Add(myClassBreakInfo2) ' Group #3 ' ======== ' Create a ClassBreakInfo object as a container of information for each group. Dim myClassBreakInfo3 As New ESRI.ArcGIS.Client.ClassBreakInfo ' Define the minimum and maximum values for the numeric grouping of the Field defined as the ' ClassBreaksRenderer.Field. myClassBreakInfo3.MinimumValue = 200 myClassBreakInfo3.MaximumValue = 1000 ' Add an informational description and label for the group. myClassBreakInfo3.Description = "200 to 1000 miles long" myClassBreakInfo3.Label = "A black dot line, width 2" ' Each ClassBreakInfo grouping needs a symbol to display. In this case the SimpleLineSymbol LineStyle ' was specified to be a Dot (rather than the default Solid). Dim mySimpleLineSymbol3 As New ESRI.ArcGIS.Client.Symbols.SimpleLineSymbol Dim myBrush3 As New System.Windows.Media.SolidColorBrush(Color.FromArgb(255, 0, 0, 0)) 'Black mySimpleLineSymbol3.Color = myBrush3 mySimpleLineSymbol3.Width = 2 mySimpleLineSymbol3.Style = ESRI.ArcGIS.Client.Symbols.SimpleLineSymbol.LineStyle.Dot myClassBreakInfo3.Symbol = mySimpleLineSymbol3 ' Add the ClassBreaksInfo information to the Classes (grouping) of the ClassBreaksRenderer myClassBreaksRenderer.Classes.Add(myClassBreakInfo3) ' Now that all of the ClassBreakInfo information has been added to the ClassBreaksRenderer object, ' associate the ClassBreaksRenderer with the FeatuerLayer.Renderer Property. myFeatureLayer2.Renderer = myClassBreaksRenderer ' Add the myFeatureLayer2 to the Map2 Layer Collection. Map2.Layers.Add(myFeatureLayer2) ' Zoom to the continental United States. Dim myEnvelope2 As New ESRI.ArcGIS.Client.Geometry.Envelope myEnvelope2.XMin = -130 myEnvelope2.YMin = 10 myEnvelope2.XMax = -70 myEnvelope2.YMax = 60 Map2.Extent = myEnvelope2 End Sub Public Sub FillClassBreaksRenderer(ByVal myMap1 As ESRI.ArcGIS.Client.Map, ByVal myMap2 As ESRI.ArcGIS.Client.Map) ' This example shows how to draw Fills (aka. Polygons) on a FeatureLayer using the ClassBreaksRenderer ' Class. This example takes two Map controls as arguments to compare the effect of applying a ' ClassBreaksRenderer. Map1 will show a basic FeatureLayer that comes by default from ArcGIS Server. ' Map2 will show the same FeatureLayer but with a specific ClassBreaksRenderer applied, to ' compare the differences. ' --------------------------------------------------------------------------------------------------------------------- ' Clear the Layers in the Map's for runs of the function. myMap1.Layers.Clear() myMap2.Layers.Clear() ' --------------------------------------------------------------------------------------------------------------------- ' Display the default FeatureLayer in myMap1 ' ========================================== ' Add an ArcGISTiledMapsServiceLayer as a background to the map. Note: The first Layer added to the Map's ' Layers Collection is on the bottom and the other Layer is added on the top. Dim myArcGISTiledMapServiceLayer1 As New ESRI.ArcGIS.Client.ArcGISTiledMapServiceLayer myArcGISTiledMapServiceLayer1.Url = "http://services.arcgisonline.com/ArcGIS/rest/services/ESRI_StreetMap_World_2D/MapServer" myMap1.Layers.Add(myArcGISTiledMapServiceLayer1) ' Add a FeatureLayer to the map. Note: This Layer is drawn on top of the background layer. Dim myFeatureLayer1 As New ESRI.ArcGIS.Client.FeatureLayer ' This FeatureLayer contains US states as Fills (aka. Polygons). myFeatureLayer1.Url = "http://sampleserver1.arcgisonline.com/ArcGIS/rest/services/Specialty/ESRI_StatesCitiesRivers_USA/MapServer/2" ' The Where clause is optional. It is necessary when more that 500/1000 records returned. In ArcGIS Server ' 9.3.1 and prior, the default maximum is 500 records returned per FeatureLayer. In ArcGIS Server 10 the ' default is 1000. This setting is configurable per map service using ArcCatalog or ArcGIS Server Manager ' (on the Parameters tab). myFeatureLayer1.Where = "1=1" ' Tip: The syntax "1=1" returns all records! ' Add the myFeatureLayer1 to the Map1 Layer Collection. myMap1.Layers.Add(myFeatureLayer1) ' Zoom to the continental United States. Dim myEnvelope1 As New ESRI.ArcGIS.Client.Geometry.Envelope myEnvelope1.XMin = -130 myEnvelope1.YMin = 10 myEnvelope1.XMax = -70 myEnvelope1.YMax = 60 myMap1.Extent = myEnvelope1 ' ----------------------------------------------------------------------------------------------------------------------- ' Display the FeatureLayer in myMap2 that has a ClassBreaksRenderer applied ' ========================================================================= ' Add an ArcGISTiledMapsServiceLayer as a background to the map. Note: The first Layer added to the Map's ' Layers Collection is on the bottom and the other Layer is added on the top. Dim myArcGISTiledMapServiceLayer2 As New ESRI.ArcGIS.Client.ArcGISTiledMapServiceLayer myArcGISTiledMapServiceLayer2.Url = "http://services.arcgisonline.com/ArcGIS/rest/services/ESRI_StreetMap_World_2D/MapServer" myMap2.Layers.Add(myArcGISTiledMapServiceLayer2) ' Add a FeatureLayer to the map. Note: This Layer is drawn on top of the background layer. Dim myFeatureLayer2 As New ESRI.ArcGIS.Client.FeatureLayer ' This FeatureLayer contains US states as Fills (aka. Polygons). myFeatureLayer2.Url = "http://sampleserver1.arcgisonline.com/ArcGIS/rest/services/Specialty/ESRI_StatesCitiesRivers_USA/MapServer/2" ' The Where clause is optional. It is necessary when more that 500/1000 records returned. In ArcGIS Server ' 9.3.1 and prior, the default maximum is 500 records returned per FeatureLayer. In ArcGIS Server 10 the ' default is 1000. This setting is configurable per map service using ArcCatalog or ArcGIS Server Manager ' (on the Parameters tab). myFeatureLayer2.Where = "1=1" ' Tip: The syntax "1=1" returns all records! ' Specify the Outfields Property to specify which Fields are returned on which the ' ClassBreaksRenderer.Field can use. Specifying the wildcard (*) character in the Add Property will ' return all Fields. myFeatureLayer2.OutFields.Add("*") ' Create the ClassBreakRenderer. Dim myClassBreaksRenderer As New ESRI.ArcGIS.Client.ClassBreaksRenderer ' Specify which Field (via its string name) the ClassBreaksRenderer will use for breaking the rendering ' of the Symbols into groups. Note: The Field that is specified for the Field Property MUST be a ' numeric (Double, Integer, SmallInteger, or Single) Field.FieldType. To Render groups of Strings use ' the UniqueValueRenderer instead. myClassBreaksRenderer.Field = "POP1990" ' Requires a numeric Field ' Define a default SimpleFillSymbol for a 'catch all' to draw the features for which no ClassBreaksInfo ' has been defined. In this example, only states with a population (POP1990) from 1,000,000 to 100,000,000 ' persons have a defined ClassBreakInfo category and yet all states will be returned. Defining a default ' SimpleFillSymbol will provide symbology for those features that are greater than 0 but less than ' 1,000,000. If a ClassBreaksRenderer.DefaultSymbol was not defined these features would not be drawn on ' the Map. Dim defaultSimpleFillSymbol As New ESRI.ArcGIS.Client.Symbols.SimpleFillSymbol Dim defaultBrush As New System.Windows.Media.SolidColorBrush(Color.FromArgb(255, 255, 255, 0)) 'Yellow defaultSimpleFillSymbol.Fill = defaultBrush myClassBreaksRenderer.DefaultSymbol = defaultSimpleFillSymbol ' A ClassBreaksRenderer should have 2 or more ClassBreakInfo Classes (meaning classification or grouping) ' to delineate the different symbology and class break information. The next three sections of code ' define 3 different ClassBreakInfo Classes (or groups) and their associated symbology. ' Group #1 ' ======== ' Create a ClassBreakInfo object as a container of information for each group. Dim myClassBreakInfo1 As New ESRI.ArcGIS.Client.ClassBreakInfo ' Define the minimum and maximum values for the numeric grouping of the Field defined as the ' ClassBreaksRenderer.Field. myClassBreakInfo1.MinimumValue = 1000000 myClassBreakInfo1.MaximumValue = 3000000 ' Add an informational description and label for the group. myClassBreakInfo1.Description = "1M to 3M people" myClassBreakInfo1.Label = "A cyan solid fill" ' Each ClassBreakInfo grouping needs a symbol to display Dim mySimpleFillSymbol1 As New ESRI.ArcGIS.Client.Symbols.SimpleFillSymbol Dim myBrush1 As New System.Windows.Media.SolidColorBrush(Color.FromArgb(255, 0, 255, 255)) 'Cyan mySimpleFillSymbol1.Fill = myBrush1 myClassBreakInfo1.Symbol = mySimpleFillSymbol1 ' Add the ClassBreaksInfo information to the Classes (grouping) of the ClassBreaksRenderer myClassBreaksRenderer.Classes.Add(myClassBreakInfo1) ' Group #2 ' ======== ' Create a ClassBreakInfo object as a container of information for each group. Dim myClassBreakInfo2 As New ESRI.ArcGIS.Client.ClassBreakInfo ' Define the minimum and maximum values for the numeric grouping of the Field defined as the ' ClassBreaksRenderer.Field. myClassBreakInfo2.MinimumValue = 3000000 myClassBreakInfo2.MaximumValue = 10000000 ' Add an informational description and label for the group. myClassBreakInfo2.Description = "3M to 10M people" myClassBreakInfo2.Label = "An olive solid fill" ' Each ClassBreakInfo grouping needs a symbol to display. Dim mySimpleFillSymbol2 As New ESRI.ArcGIS.Client.Symbols.SimpleFillSymbol Dim myBrush2 As New System.Windows.Media.SolidColorBrush(Color.FromArgb(255, 107, 142, 35)) ' Olive mySimpleFillSymbol2.Fill = myBrush2 myClassBreakInfo2.Symbol = mySimpleFillSymbol2 ' Add the ClassBreaksInfo information to the Classes (grouping) of the ClassBreaksRenderer myClassBreaksRenderer.Classes.Add(myClassBreakInfo2) ' Group #3 ' ======== ' Create a ClassBreakInfo object as a container of information for each group. Dim myClassBreakInfo3 As New ESRI.ArcGIS.Client.ClassBreakInfo ' Define the minimum and maximum values for the numeric grouping of the Field defined as the ' ClassBreaksRenderer.Field. myClassBreakInfo3.MinimumValue = 10000000 myClassBreakInfo3.MaximumValue = 100000000 ' Add an informational description and label for the group. myClassBreakInfo3.Description = "10M to 100M people" myClassBreakInfo3.Label = "A black solid fill" ' Each ClassBreakInfo grouping needs a symbol to display. Dim mySimpleFillSymbol3 As New ESRI.ArcGIS.Client.Symbols.SimpleFillSymbol Dim myBrush3 As New System.Windows.Media.SolidColorBrush(Color.FromArgb(255, 0, 0, 0)) 'BLACK mySimpleFillSymbol3.Fill = myBrush3 myClassBreakInfo3.Symbol = mySimpleFillSymbol3 ' Add the ClassBreaksInfo information to the Classes (grouping) of the ClassBreaksRenderer myClassBreaksRenderer.Classes.Add(myClassBreakInfo3) ' Now that all of the ClassBreakInfo information has been added to the ClassBreaksRenderer object, ' associate the ClassBreaksRenderer with the FeatuerLayer.Renderer Property. myFeatureLayer2.Renderer = myClassBreaksRenderer ' Add the myFeatureLayer2 to the Map2 Layer Collection. Map2.Layers.Add(myFeatureLayer2) ' Zoom to the continental United States. Dim myEnvelope2 As New ESRI.ArcGIS.Client.Geometry.Envelope myEnvelope2.XMin = -130 myEnvelope2.YMin = 10 myEnvelope2.XMax = -70 myEnvelope2.YMax = 60 Map2.Extent = myEnvelope2 End Sub | |
Remarks
The following image depicts how a Map would look that corresponds to XAML code with a ClassBreaksRenderer defined for a FeatureLayer.
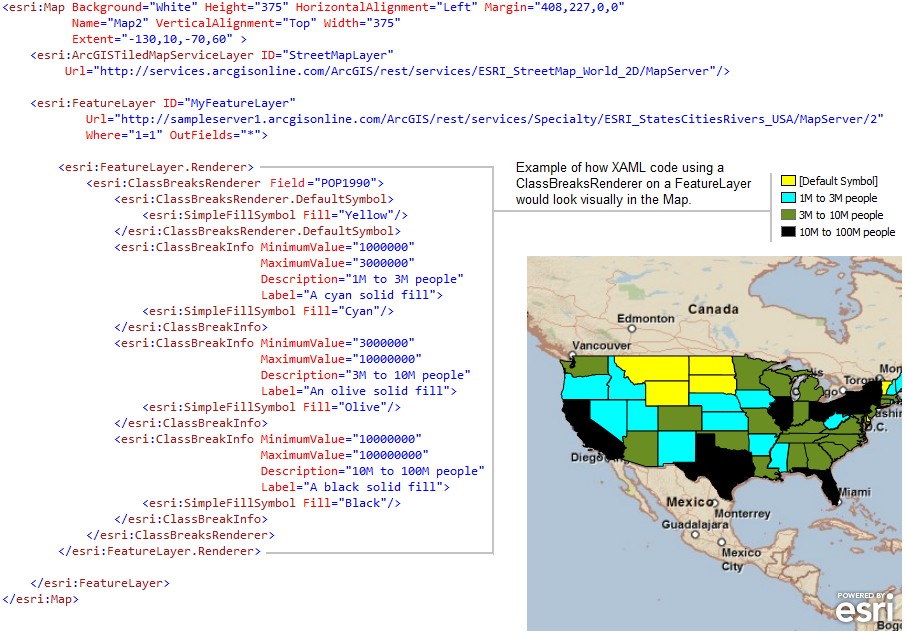
A ClassBreaksRenderer should have 2 or more ClassBreakInfo objects defined by the Classes Property (meaning classification or grouping) to delineate the different symbology and class break information. Otherwise, use a SimpleRenderer if just one type of symbology needs to be rendered.
The name of the Field that is specified for the Field Property must be a numeric (Double, Integer, SmallInteger, or Single) Field.FieldType. To render groups of Strings use the UniqueValueRenderer instead.
Defining a DefaultSymbol provides a 'catch all' to draw the features for which no ClassBreakInfo's have been defined. If a DefaultSymbol is not defined, the Layer features will not be drawn on the Map when there is no grouping defined by the ClassBreakInfo's. For example: assume that a Layer has numerical observations that range from 1 to 90. If three ClassBreakInfo objects were defined that covered the grouped ranges of: (#1) 10 to 30, (#2) 30 to 60, and (#3) 60 to 90, unless a DefaultSymbol is defined there will be no visual representations visible on the map for the numerical range of 1 to 9.Inheritance Hierarchy
System.Object
System.Windows.Threading.DispatcherObject
System.Windows.DependencyObject
ESRI.ArcGIS.Client.ClassBreaksRenderer
Requirements
Target Platforms: Windows XP Professional, Windows Server 2003 family, Windows Vista, Windows Server 2008 family