


 Object Model
Syntax
| Visual Basic (Declaration) | |
|---|---|
Public Class TimeClassBreaksAger Inherits System.Windows.DependencyObject Implements ISymbolInterpolator | |
| C# | |
|---|---|
public class TimeClassBreaksAger : System.Windows.DependencyObject, ISymbolInterpolator | |
Example
| XAML |  Copy Code Copy Code |
|---|---|
<Grid x:Name="LayoutRoot" Background="White"> <!-- Display the FeatureLayer in Map2 that has a TemporalRenderer applied: Add an ArcGISTiledMapsServiceLayer as a background to the map. The ArcGISTiledMapsServiceLayer layer is first Layer added to the Map's Layers Collection and is drawn on the bottom. A FeatureLayer is then added to the map and draws on top of the background layer. Set the Map2 Extent to zoom to the middle of the Atlantic ocean. Setting the Map's TimeExtent acts like a Where clause in that only those features/records that fall within the set TimeExtent will then be shown. If no Map TimeExtent is set then only the ObservationRenderer is in effect. If a Map TimeExtent is set then the ObservationRenderer and the TrackRenderer are in effect. In the case of this example the TimeExtent for the hurricane information is shortened to a small temporal window that just covers the time extent necessary to render the two hurricanes (Alberto and Debby) that are returned by the service. Manually setting the TimeExtent of the Map2. Could have bound to a TimeSlider for more interactiveness. --> <esri:Map Background="White" Height="375" HorizontalAlignment="Left" Margin="408,227,0,0" Name="Map2" VerticalAlignment="Top" Width="375" Extent="-77.69,-13.88,-11.77,52.03" TimeExtent="2000/08/03 00:00:01 UTC,2000/08/24 00:00:01 UTC"> <esri:ArcGISTiledMapServiceLayer ID="StreetMapLayer" Url="http://services.arcgisonline.com/ArcGIS/rest/services/ESRI_StreetMap_World_2D/MapServer"/> <!-- The FeatureLayer contains Hurricane data from NOAA as Markers (aka. Points). The Where clause is optional. It is necessary when more that 500/1000 records returned. In ArcGIS Server 9.3.1 and prior, the default maximum is 500 records returned per FeatureLayer. In ArcGIS Server 10 the default is 1000. This setting is configurable per map service using ArcCatalog or ArcGIS Server Manager (on the Parameters tab). The Where clause gets the temporal observations of two hurricanes (Alberto and Debby). Specify the Outfields Property to specify which Fields are returned on which the TemporalRenderer TrackIdField can use. Specifying the wildcard (*) character in the Add Property will return all Fields. --> <esri:FeatureLayer ID="MyFeatureLayer" Url="http://servicesbeta.esri.com/ArcGIS/rest/services/Hurricanes/Hurricanes/MapServer/0" Where="EVENTID = 'Alberto' OR EVENTID = 'Debby'" OutFields="*"> <esri:FeatureLayer.Renderer> <!-- Create the TemporalRenderer object. It will use two different Properties (ObservationRenderer and TrackRenderer) to create the image. Specify which TrackIdField (via its string name) the TemporalRenderer will use for breaking the rendering of the polyline event Symbols into groups. Setting the TrackIDField draws polylines in time order for a group of attributes. If the TrackIDField property is not set and the TrackRenderer is used, then all point observations will have a polyline connecting them in order of time. This becomes messy if multiple events are occurring at the same time (i.e. hurricanes) and the linework would then look like a spider diagram rather than discreet tracks with one per event. In this example to speed up drawing time and limit the amount of data that is returned, the FeatureLayer Where clause was used to restrict only two hurricanes (or events) from displaying. If the FeatureLayer Where clause was commented out, more hurricanes would be displayed. Having the TrackIdField becomes key to keeping each event separate. --> <esri:TemporalRenderer TrackIdField="EVENTID"> <!-- ObservationRenderer Property: Define the default symbology for the FeatureLayer.TemporalRenderer.ObservationRenderer. Use a SimpleRenderer so that each temporal observation has some type of symbology. If the default symbol's Style, Color, and Size are not specified, then whatever is defined by the ArcGIS Server web service will be returned for the symbology of the FeatureLayers temporal observations. --> <esri:TemporalRenderer.ObservationRenderer> <esri:SimpleRenderer> <esri:SimpleMarkerSymbol Color="Black" Size="4" Style="Circle"/> </esri:SimpleRenderer> </esri:TemporalRenderer.ObservationRenderer> <!-- TrackRenderer Property: Define a SimpleRenderer with a SimpleLineSymbol to display each tracked event. The event will be a yellow line connecting the time-based observations. --> <esri:TemporalRenderer.TrackRenderer> <esri:SimpleRenderer> <esri:SimpleLineSymbol Color="Yellow" Width="1"/> </esri:SimpleRenderer> </esri:TemporalRenderer.TrackRenderer> <!-- SymbolAger Property: Define a TimeClassBreaksAger to override the default symbology of the ObservationRenderer as the Map.TimeExtent Property of the FeatureLayer changes. Use TimeClassBreakInfo objects to define groups of temporal windows that will span across the Map.TimeExtent via MinimumAge and MaximumAge ranges. The symbol defined by the ObservationRenderer is overridden by each TimeClassBreakInfo object via: The ObservationRenderer's Symbol Color <== TimeClassBreakInfo.Color The ObservationRenderer's Symbol Size <== TimeClassBreakInfo.Size The ObservationRenderer's Symbol visibility <== TimeClassBreakInfo.Opacity If the TimeClassBreakInfo Classes do not completely cover the entire Map.TimeExtent then whatever has been established as the ObservationRenderer will draw for those features. The TimeClassBreaksAger is similar to the ClassBreaksRenderer in that groups are defined to render symbology but uses time intervals to override what was established by the ObservationRenderer. Some may find that setting the TimeClassBreakInfo .MinimumAge and .MaximumAge a little counter-intuitive. The MinimumAge values are the newer temporal observations. The MaximumAge values are the older temporal observations. In this example there are 3 defined groups to age the data. The 3 groups do not cover the entire temporal span of the data defined by the Map.TimeExtent. The oldest data observations are not covered by the 3 groups and hence are renderer by what was originally defined in the ObseravtionRenderer. Make sure that the TimeClassBreaksAger.Units Property corresponds with the appropriate values that are set for the TimeClassBreakInfo .MinimumAge and .MaximumAge values. --> <esri:TemporalRenderer.SymbolAger> <esri:TimeClassBreaksAger Unit="Days"> <!-- The MinimumAge = 0.0 is equivalent to the date 2000/08/24 00:00:01 UTC The MaximumAge = 2.0 is equivalent to the date 2000/08/22 00:00:01 UTC --> <esri:TimeClassBreakInfo Color="White" Size="10" MinimumAge="0.0" MaximumAge="2.0"/> <!-- The MinimumAge = 2.0 is equivalent to the date 2000/08/22 00:00:01 UTC The MaximumAge = 5.0 is equivalent to the date 2000/08/19 00:00:01 UTC --> <esri:TimeClassBreakInfo Color="Blue" Size="7" MinimumAge="2.0" MaximumAge="5.0"/> <!-- The MinimumAge = 5.0 is equivalent to the date 2000/08/19 00:00:01 UTC The MaximumAge = 12.0 is equivalent to the date 2000/08/12 00:00:01 UTC --> <esri:TimeClassBreakInfo Color="Red" Size="5" MinimumAge="5.0" MaximumAge="12.0"/> <!-- NOTE: For the temporal observations older than 12 days (#8/12/2000 12:00:01 AM#) the ObservationRenderer is in full effect since no additional TimeClassBreakInfo is defined to cover the oldest hurricane occurrences. --> </esri:TimeClassBreaksAger> </esri:TemporalRenderer.SymbolAger> </esri:TemporalRenderer> </esri:FeatureLayer.Renderer> </esri:FeatureLayer> </esri:Map> </Grid> | |
| C# | Copy Code |
|---|---|
public void DrawTimeClassBreaksAger(ESRI.ArcGIS.Client.Map myMap) { // Display the FeatureLayer in myMap that has a TemporalRenderer applied // ====================================================================== // Clear out any exiting layers myMap.Layers.Clear(); // Add an ArcGISTiledMapsServiceLayer as a background to the map. Note: The first Layer added to the Map's // Layers Collection is on the bottom and the other Layer is added on the top. ESRI.ArcGIS.Client.ArcGISTiledMapServiceLayer myArcGISTiledMapServiceLayer2 = new ESRI.ArcGIS.Client.ArcGISTiledMapServiceLayer(); myArcGISTiledMapServiceLayer2.Url = "http://services.arcgisonline.com/ArcGIS/rest/services/ESRI_StreetMap_World_2D/MapServer"; myMap.Layers.Add(myArcGISTiledMapServiceLayer2); // Add a FeatureLayer to the map. Note: This Layer is drawn on top of the background layer. ESRI.ArcGIS.Client.FeatureLayer myFeatureLayer = new ESRI.ArcGIS.Client.FeatureLayer(); // This FeatureLayer contains hurricane data from NOAA. myFeatureLayer.Url = "http://servicesbeta.esri.com/ArcGIS/rest/services/Hurricanes/Hurricanes/MapServer/0"; // The Where clause is optional. It is necessary when more that 500/1000 records returned. In ArcGIS Server // 9.3.1 and prior, the default maximum is 500 records returned per FeatureLayer. In ArcGIS Server 10 the // default is 1000. This setting is configurable per map service using ArcCatalog or ArcGIS Server Manager // (on the Parameters tab). // Only two hurricanes (Alberto and Debby) are returned for this Where clause. myFeatureLayer.Where = "EVENTID = 'Alberto' OR EVENTID = 'Debby'"; // Specify the Outfields Property to specify which Fields are returned on which the // TemporalRenderer.TrackIDField can use. Specifying the wildcard (*) character in the Add Property // will return all Fields. myFeatureLayer.OutFields.Add("*"); // Setting the Map's TimeExtent acts like a Where clause in that only those features/records that fall // within the set TimeExtent will then be shown. If no Map.TimeExtent is set then only the // ObservationRenderer is in effect. If a Map.TimeExtent is set then the ObservationRenderer and the // TrackRenderer are in effect. In the case of this example the TimeExtent for the hurricane // information is shortened to a small temporal window that just covers the time extent necessary to // render the two hurricanes (Alberto and Debby) that are returned by the service. ESRI.ArcGIS.Client.TimeExtent myTimeExtent = new ESRI.ArcGIS.Client.TimeExtent(); System.DateTime dateStart = DateTime.Parse("8/3/2000 12:00:01 AM"); //Custom Start date/time myTimeExtent.Start = dateStart; System.DateTime dateEnd = DateTime.Parse("8/24/2000 12:00:01 AM"); //Custom End date/time myTimeExtent.End = dateEnd; // Manually setting the TimeExtent of the myMap. Could have used a TimeSlider for more interactiveness. myMap.TimeExtent = myTimeExtent; // Create the TemporalRenderer object. It will use two different Properties (ObservationRenderer, // and TrackRenderer) to create the image. ESRI.ArcGIS.Client.TemporalRenderer myTemporalRenderer = new ESRI.ArcGIS.Client.TemporalRenderer(); // Define the default symbology for the FeatureLayer.TemporalRenderer.ObservationRenderer. Use a // SimpleRenderer so that each temporal observation has some type of symbology. If the default symbol's // .Style, .Color, and .Size are not specified, then whatever is defined by the ArcGIS Server web service // will be returned for the symbology of the FeatureLayers temporal observations. ESRI.ArcGIS.Client.SimpleRenderer mySimpleRenderer_ObservationRenderer = new ESRI.ArcGIS.Client.SimpleRenderer(); ESRI.ArcGIS.Client.Symbols.SimpleMarkerSymbol mySimpleMarkerSymbol = new ESRI.ArcGIS.Client.Symbols.SimpleMarkerSymbol(); System.Windows.Media.SolidColorBrush mySolidColorBrush = new System.Windows.Media.SolidColorBrush(Color.FromArgb(255, 0, 0, 0)); //Black mySimpleMarkerSymbol.Color = mySolidColorBrush; mySimpleMarkerSymbol.Size = 4; mySimpleMarkerSymbol.Style = ESRI.ArcGIS.Client.Symbols.SimpleMarkerSymbol.SimpleMarkerStyle.Circle; mySimpleRenderer_ObservationRenderer.Symbol = mySimpleMarkerSymbol; myTemporalRenderer.ObservationRenderer = mySimpleRenderer_ObservationRenderer; // TrackRenderer Property: // Setting the TrackIDField draws polylines in time order for a group of attributes. If the // TrackIDField property is not set and the TrackRenderer is used, then all point observations // will have a polyline connecting them in order of time. This becomes messy if multiple // events are occurring at the same time (i.e. hurricanes) and the linework would then look like // a spider diagram rather than discreet tracks with one per event. In this example to speed up // drawing time and limit the amount of data that is returned, the FeatureLayer.Where clause was // used to restrict only two hurricanes (or event) from displaying. If the FeatureLayer.Where // clause was commented out, more hurricanes would be displayed -- having the TrackIdField // becomes key to keeping each event separate. myTemporalRenderer.TrackIdField = "EVENTID"; // Define a SimpleRenderer with a SimpleLineSymbol to display each tracked event. The event // will be a yellow line connecting the time-based observations. ESRI.ArcGIS.Client.SimpleRenderer mySimpleRenderer_TrackRenderer = new ESRI.ArcGIS.Client.SimpleRenderer(); ESRI.ArcGIS.Client.Symbols.SimpleLineSymbol mySimpleLineSymbol = new ESRI.ArcGIS.Client.Symbols.SimpleLineSymbol(); System.Windows.Media.SolidColorBrush mySolidColorBrush_TrackRenderer = new System.Windows.Media.SolidColorBrush(Color.FromArgb(255, 255, 255, 0)); //Yellow mySimpleLineSymbol.Color = mySolidColorBrush_TrackRenderer; mySimpleLineSymbol.Width = 1; mySimpleRenderer_TrackRenderer.Symbol = mySimpleLineSymbol; myTemporalRenderer.TrackRenderer = mySimpleRenderer_TrackRenderer; // Define a TimeClassBreaksAger to override the default symbology of the ObservationRenderer as the // Map.TimeExtent Property of the FeatureLayer changes. Use TimeClassBreakInfo objects to define // groups of temporal windows that will span across the Map.TimeExtent via MinimumAge and MaximumAge // ranges. The symbol defined by the ObservationRenderer is overridden by each TimeClassBreakInfo // object via: // The ObservationRenderer's Symbol Color <== TimeClassBreakInfo.Color // The ObservationRenderer's Symbol Size <== TimeClassBreakInfo.Size // The ObservationRenderer's Symbol visibility <== TimeClassBreakInfo.Opacity // // If the TimeClassBreakInfo Classes do not completely cover the entire Map.TimeExtent then whatever // has been established as the ObservationRenderer will draw for those features. // // The TimeClassBreaksAger is similar to the ClassBreaksRenderer in that groups are defined to render // symbology but uses time intervals to override what was established by the ObservationRenderer. // // Some may find that setting the TimeClassBreakInfo .MinimumAge and .MaximumAge a little counter-intuitive. // The MinimumAge values are the newer temporal observations. The MaximumAge values are the older temporal // observations. In this example there are 3 defined groups to age the data. The 3 groups do not cover the // entire temporal span of the data defined by the Map.TimeExtent. The oldest data observations are not // covered by the 3 groups and hence are renderer by what was originally defined in the ObseravtionRenderer. // // Make sure that the TimeClassBreaksAger.Units Property corresponds with the appropriate values that are set // for the TimeClassBreakInfo .MinimumAge and .MaximumAge values. // // Uncomment the various TimeClassBreakInfo.Opacity settings to see the different effects. // Define the TimeClassBreaksAger and set the Units to Days. ESRI.ArcGIS.Client.TimeClassBreaksAger myTimeClassBreaksAger = new ESRI.ArcGIS.Client.TimeClassBreaksAger(); myTimeClassBreaksAger.Unit = ESRI.ArcGIS.Client.TimeUnit.Days; // 1st grouping. This displays the most recent temporal observations. ESRI.ArcGIS.Client.TimeClassBreakInfo myTimeClassBreakInfo1 = new ESRI.ArcGIS.Client.TimeClassBreakInfo(); myTimeClassBreakInfo1.Color = Color.FromArgb(255, 255, 255, 255); //White myTimeClassBreakInfo1.MinimumAge = 0.0; //Equivalent to the date #8/24/2000 12:00:01 AM# myTimeClassBreakInfo1.MaximumAge = 2.0; //Equivalent to the date #8/22/2000 12:00:01 AM# //myTimeClassBreakInfo1.Opacity = 1 '1 = completely visible, 0 = invisible myTimeClassBreakInfo1.Size = 10; myTimeClassBreaksAger.TimeClasses.Add(myTimeClassBreakInfo1); // 2nd grouping. This displays slightly older temporal observations. ESRI.ArcGIS.Client.TimeClassBreakInfo myTimeClassBreakInfo2 = new ESRI.ArcGIS.Client.TimeClassBreakInfo(); myTimeClassBreakInfo2.Color = Color.FromArgb(255, 0, 0, 255); //Blue myTimeClassBreakInfo2.MinimumAge = 2.0; //Equivalent to the date #8/22/2000 12:00:01 AM# myTimeClassBreakInfo2.MaximumAge = 5.0; //Equivalent to the date #8/19/2000 12:00:01 AM# //myTimeClassBreakInfo2.Opacity = 0.5 '1 = completely visible, 0 = invisible myTimeClassBreakInfo2.Size = 7; myTimeClassBreaksAger.TimeClasses.Add(myTimeClassBreakInfo2); // 3rd grouping. This displays the even older temporal observations. ESRI.ArcGIS.Client.TimeClassBreakInfo myTimeClassBreakInfo3 = new ESRI.ArcGIS.Client.TimeClassBreakInfo(); myTimeClassBreakInfo3.Color = Color.FromArgb(255, 255, 0, 0); //Red myTimeClassBreakInfo3.MinimumAge = 5.0; //Equivalent to the date #8/19/2000 12:00:01 AM# myTimeClassBreakInfo3.MaximumAge = 12.0; //Equivalent to the date #8/12/2000 12:00:01 AM# //myTimeClassBreakInfo3.Opacity = 0.1 '1 = completely visible, 0 = invisible myTimeClassBreakInfo3.Size = 5; myTimeClassBreaksAger.TimeClasses.Add(myTimeClassBreakInfo3); // NOTE: For the temporal observations older than 12 days (#8/12/2000 12:00:01 AM#) the // ObservationRenderer is in full effect since no additional TimeClassBreakInfo is defined // to cover the oldest hurricane occurrences. // Set the TimeClassBreaksAger as the TemporalRenderer.SymbolAger myTemporalRenderer.SymbolAger = myTimeClassBreaksAger; // Apply the TemporalRenderer as the Renderer of the FeatureLayer. myFeatureLayer.Renderer = myTemporalRenderer; // Add the myFeatureLayer to the myMap Layer Collection. myMap.Layers.Add(myFeatureLayer); // Zoom to the middle of the Atlantic ocean. ESRI.ArcGIS.Client.Geometry.Envelope myEnvelope2 = new ESRI.ArcGIS.Client.Geometry.Envelope(); myEnvelope2.XMin = -77.69; myEnvelope2.YMin = -13.88; myEnvelope2.XMax = -11.77; myEnvelope2.YMax = 52.03; myMap.Extent = myEnvelope2; } | |
| VB.NET | Copy Code |
|---|---|
Public Sub DrawTimeClassBreaksAger(ByVal myMap As ESRI.ArcGIS.Client.Map) ' Display the FeatureLayer in myMap that has a TemporalRenderer applied ' ====================================================================== ' Clear out any exiting layers myMap.Layers.Clear() ' Add an ArcGISTiledMapsServiceLayer as a background to the map. Note: The first Layer added to the Map's ' Layers Collection is on the bottom and the other Layer is added on the top. Dim myArcGISTiledMapServiceLayer2 As New ESRI.ArcGIS.Client.ArcGISTiledMapServiceLayer myArcGISTiledMapServiceLayer2.Url = "http://services.arcgisonline.com/ArcGIS/rest/services/ESRI_StreetMap_World_2D/MapServer" myMap.Layers.Add(myArcGISTiledMapServiceLayer2) ' Add a FeatureLayer to the map. Note: This Layer is drawn on top of the background layer. Dim myFeatureLayer As New ESRI.ArcGIS.Client.FeatureLayer ' This FeatureLayer contains hurricane data from NOAA. myFeatureLayer.Url = "http://servicesbeta.esri.com/ArcGIS/rest/services/Hurricanes/Hurricanes/MapServer/0" ' The Where clause is optional. It is necessary when more that 500/1000 records returned. In ArcGIS Server ' 9.3.1 and prior, the default maximum is 500 records returned per FeatureLayer. In ArcGIS Server 10 the ' default is 1000. This setting is configurable per map service using ArcCatalog or ArcGIS Server Manager ' (on the Parameters tab). ' Only two hurricanes (Alberto and Debby) are returned for this Where clause. myFeatureLayer.Where = "EVENTID = 'Alberto' OR EVENTID = 'Debby'" ' Specify the Outfields Property to specify which Fields are returned on which the ' TemporalRenderer.TrackIDField can use. Specifying the wildcard (*) character in the Add Property ' will return all Fields. myFeatureLayer.OutFields.Add("*") ' Setting the Map's TimeExtent acts like a Where clause in that only those features/records that fall ' within the set TimeExtent will then be shown. If no Map.TimeExtent is set then only the ' ObservationRenderer is in effect. If a Map.TimeExtent is set then the ObservationRenderer and the ' TrackRenderer are in effect. In the case of this example the TimeExtent for the hurricane ' information is shortened to a small temporal window that just covers the time extent necessary to ' render the four hurricanes (Alberto and Debby) that are returned by the service. Dim myTimeExtent As New ESRI.ArcGIS.Client.TimeExtent Dim dateStart As Date = #8/3/2000 12:00:01 AM# 'Custom Start date/time myTimeExtent.Start = dateStart Dim dateEnd As Date = #8/24/2000 12:00:01 AM# 'Custom End date/time myTimeExtent.End = dateEnd ' Manually setting the TimeExtent of the myMap. Could have used a TimeSlider for more interactiveness. myMap.TimeExtent = myTimeExtent ' Create the TemporalRenderer object. It will use two different Properties (ObservationRenderer, ' and TrackRenderer) to create the image. Dim myTemporalRenderer As New ESRI.ArcGIS.Client.TemporalRenderer ' Define the default symbology for the FeatureLayer.TemporalRenderer.ObservationRenderer. Use a ' SimpleRenderer so that each temporal observation has some type of symbology. If the default symbol's ' .Style, .Color, and .Size are not specified, then whatever is defined by the ArcGIS Server web service ' will be returned for the symbology of the FeatureLayers temporal observations. Dim mySimpleRenderer_ObservationRenderer As New ESRI.ArcGIS.Client.SimpleRenderer Dim mySimpleMarkerSymbol As New ESRI.ArcGIS.Client.Symbols.SimpleMarkerSymbol Dim mySolidColorBrush As New System.Windows.Media.SolidColorBrush(Color.FromArgb(255, 0, 0, 0)) 'Black mySimpleMarkerSymbol.Color = mySolidColorBrush mySimpleMarkerSymbol.Size = 4 mySimpleMarkerSymbol.Style = ESRI.ArcGIS.Client.Symbols.SimpleMarkerSymbol.SimpleMarkerStyle.Circle mySimpleRenderer_ObservationRenderer.Symbol = mySimpleMarkerSymbol myTemporalRenderer.ObservationRenderer = mySimpleRenderer_ObservationRenderer ' TrackRenderer Property: ' Setting the TrackIDField draws polylines in time order for a group of attributes. If the ' TrackIDField property is not set and the TrackRenderer is used, then all point observations ' will have a polyline connecting them in order of time. This becomes messy if multiple ' events are occurring at the same time (i.e. hurricanes) and the linework would then look like ' a spider diagram rather than discreet tracks with one per event. In this example to speed up ' drawing time and limit the amount of data that is returned, the FeatureLayer.Where clause was ' used to restrict only two hurricanes (or event) from displaying. If the FeatureLayer.Where ' clause was commented out, more hurricanes would be displayed -- having the TrackIdField ' becomes key to keeping each event separate. myTemporalRenderer.TrackIdField = "EVENTID" ' Define a SimpleRenderer with a SimpleLineSymbol to display each tracked event. The event ' will be a yellow line connecting the time-based observations. Dim mySimpleRenderer_TrackRenderer As New ESRI.ArcGIS.Client.SimpleRenderer Dim mySimpleLineSymbol As New ESRI.ArcGIS.Client.Symbols.SimpleLineSymbol Dim mySolidColorBrush_TrackRenderer As New System.Windows.Media.SolidColorBrush(Color.FromArgb(255, 255, 255, 0)) 'Yellow mySimpleLineSymbol.Color = mySolidColorBrush_TrackRenderer mySimpleLineSymbol.Width = 1 mySimpleRenderer_TrackRenderer.Symbol = mySimpleLineSymbol myTemporalRenderer.TrackRenderer = mySimpleRenderer_TrackRenderer ' Define a TimeClassBreaksAger to override the default symbology of the ObservationRenderer as the ' Map.TimeExtent Property of the FeatureLayer changes. Use TimeClassBreakInfo objects to define ' groups of temporal windows that will span across the Map.TimeExtent via MinimumAge and MaximumAge ' ranges. The symbol defined by the ObservationRenderer is overridden by each TimeClassBreakInfo ' object via: ' The ObservationRenderer's Symbol Color <== TimeClassBreakInfo.Color ' The ObservationRenderer's Symbol Size <== TimeClassBreakInfo.Size ' The ObservationRenderer's Symbol visibility <== TimeClassBreakInfo.Opacity ' ' If the TimeClassBreakInfo Classes do not completely cover the entire Map.TimeExtent then whatever ' has been established as the ObservationRenderer will draw for those features. ' ' The TimeClassBreaksAger is similar to the ClassBreaksRenderer in that groups are defined to render ' symbology but uses time intervals to override what was established by the ObservationRenderer. ' ' Some may find that setting the TimeClassBreakInfo .MinimumAge and .MaximumAge a little counter-intuitive. ' The MinimumAge values are the newer temporal observations. The MaximumAge values are the older temporal ' observations. In this example there are 3 defined groups to age the data. The 3 groups do not cover the ' entire temporal span of the data defined by the Map.TimeExtent. The oldest data observations are not ' covered by the 3 groups and hence are renderer by what was originally defined in the ObseravtionRenderer. ' ' Make sure that the TimeClassBreaksAger.Units Property corresponds with the appropriate values that are set ' for the TimeClassBreakInfo .MinimumAge and .MaximumAge values. ' ' Uncomment the various TimeClassBreakInfo.Opacity settings to see the different effects. ' Define the TimeClassBreaksAger and set the Units to Days. Dim myTimeClassBreaksAger As New ESRI.ArcGIS.Client.TimeClassBreaksAger myTimeClassBreaksAger.Unit = ESRI.ArcGIS.Client.TimeUnit.Days ' 1st grouping. This displays the most recent temporal observations. Dim myTimeClassBreakInfo1 As New ESRI.ArcGIS.Client.TimeClassBreakInfo myTimeClassBreakInfo1.Color = Color.FromArgb(255, 255, 255, 255) 'White myTimeClassBreakInfo1.MinimumAge = 0.0 'Equivalent to the date #8/24/2000 12:00:01 AM# myTimeClassBreakInfo1.MaximumAge = 2.0 'Equivalent to the date #8/22/2000 12:00:01 AM# 'myTimeClassBreakInfo1.Opacity = 1 '1 = completely visible, 0 = invisible myTimeClassBreakInfo1.Size = 10 myTimeClassBreaksAger.TimeClasses.Add(myTimeClassBreakInfo1) ' 2nd grouping. This displays slightly older temporal observations. Dim myTimeClassBreakInfo2 As New ESRI.ArcGIS.Client.TimeClassBreakInfo myTimeClassBreakInfo2.Color = Color.FromArgb(255, 0, 0, 255) 'Blue myTimeClassBreakInfo2.MinimumAge = 2.0 'Equivalent to the date #8/22/2000 12:00:01 AM# myTimeClassBreakInfo2.MaximumAge = 5.0 'Equivalent to the date #8/19/2000 12:00:01 AM# 'myTimeClassBreakInfo2.Opacity = 0.5 '1 = completely visible, 0 = invisible myTimeClassBreakInfo2.Size = 7 myTimeClassBreaksAger.TimeClasses.Add(myTimeClassBreakInfo2) ' 3rd grouping. This displays the even older temporal observations. Dim myTimeClassBreakInfo3 As New ESRI.ArcGIS.Client.TimeClassBreakInfo myTimeClassBreakInfo3.Color = Color.FromArgb(255, 255, 0, 0) 'Red myTimeClassBreakInfo3.MinimumAge = 5.0 'Equivalent to the date #8/19/2000 12:00:01 AM# myTimeClassBreakInfo3.MaximumAge = 12.0 'Equivalent to the date #8/12/2000 12:00:01 AM# 'myTimeClassBreakInfo3.Opacity = 0.1 '1 = completely visible, 0 = invisible myTimeClassBreakInfo3.Size = 5 myTimeClassBreaksAger.TimeClasses.Add(myTimeClassBreakInfo3) ' NOTE: For the temporal observations older than 12 days (#8/12/2000 12:00:01 AM#) the ' ObservationRenderer is in full effect since no additional TimeClassBreakInfo is defined ' to cover the oldest hurricane occurrences. ' Set the TimeClassBreaksAger as the TemporalRenderer.SymbolAger myTemporalRenderer.SymbolAger = myTimeClassBreaksAger ' Apply the TemporalRenderer as the Renderer of the FeatureLayer. myFeatureLayer.Renderer = myTemporalRenderer ' Add the myFeatureLayer to the myMap Layer Collection. myMap.Layers.Add(myFeatureLayer) ' Zoom to the middle of the Atlantic ocean. Dim myEnvelope2 As New ESRI.ArcGIS.Client.Geometry.Envelope myEnvelope2.XMin = -77.69 myEnvelope2.YMin = -13.88 myEnvelope2.XMax = -11.77 myEnvelope2.YMax = 52.03 myMap.Extent = myEnvelope2 End Sub | |
Remarks
The TimeClassBreaksAger overrides the default symbology of the ObservationRenderer as the Map.TimeExtent Property of the FeatureLayer changes. Use TimeClassBreakInfo objects to define groups of temporal windows that will span across the Map.TimeExtent via TimeClassBreakInfo.MinimumAge and TimeClassBreakInfo.MaximumAge ranges. The symbol defined by the ObservationRenderer is overridden by each TimeClassBreakInfo object via:
- The ObservationRenderer's Symbol Color <== TimeClassBreakInfo.Color
- The ObservationRenderer's Symbol Size <== TimeClassBreakInfo.Size
- The ObservationRenderer's Symbol visibility <== TimeClassBreakInfo.Opacity
If the TimeClassBreakInfo Classes do not completely cover the entire Map.TimeExtent then whatever has been established as the ObservationRenderer will draw for those features.
The TimeClassBreaksAger is similar to the ClassBreaksRenderer in that groups are defined to render symbology but uses time intervals to override what was established by the ObservationRenderer.
Some may find that setting the TimeClassBreakInfo MinimumAge and MaximumAge a little counter-intuitive. The MinimumAge values are the newer temporal observations. The MaximumAge values are the older temporal observations.
Make sure that the Unit Property corresponds with the appropriate values that are set for the TimeClassBreakInfo MinimumAge and MaximumAge values.
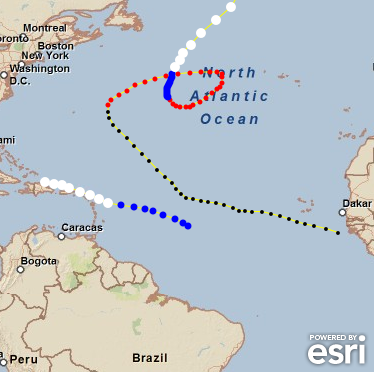
The following screen shot depicts two hurricanes (Alberto and Debby) that cover the time period of August 3, 2000 to August 24, 2000. The image shows how the TimeClassBreaksAger can be used to age time based data associated with TemporalRenderer. The default symbol that is specified for the ObservationRenderer is a small black circle. The color and size of the symbology of the two hurricane’s movements change over the time period. For the dates August 24 to August 22 the symbol is a large white circle. For the dates August 22 to August 19 the symbol is a medium blue circle. For the dates August 19 to August 12 the symbol is a small red circle. For remainder of the dates (specifically August 12 to August 3) the ObservationRender is shown.
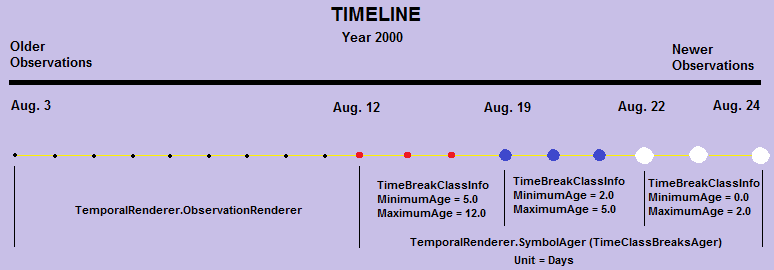
To help clarify how the TimeClassBreaksAger and the TimeBreakClassInfo groupings work a visual representation depicting a timeline for the code example is provided here:
Inheritance Hierarchy
System.Object
System.Windows.Threading.DispatcherObject
System.Windows.DependencyObject
ESRI.ArcGIS.Client.TimeClassBreaksAger
Requirements
Target Platforms: Windows XP Professional, Windows Server 2003 family, Windows Vista, Windows Server 2008 family