


 Syntax
| Visual Basic (Declaration) | |
|---|---|
Public Property ObservationRenderer As IRenderer | |
| C# | |
|---|---|
public IRenderer ObservationRenderer {get; set;} | |
Example
| XAML |  Copy Code Copy Code |
|---|---|
<Grid x:Name="LayoutRoot" Background="White"> <!-- Display the FeatureLayer in myMap2 that has a TemporalRenderer applied: Add an ArcGISTiledMapsServiceLayer as a background to the map. The ArcGISTiledMapsServiceLayer layer is first Layer added to the Map's Layers Collection and is drawn on the bottom. A FeatureLayer is then added to the map and draws on top of the background layer. Set the Map2 Extent to zoom to the North and South America. Setting the Map's TimeExtent acts like a Where clause in that only those features/records that fall within the set TimeExtent will then be shown. In the case of this example the TimeExtent for the earthquakes is shortened to a smaller temporal window to display the various rendering effects clearly. Manually setting the TimeExtent of the Map2. Could have bound to a TimeSlider for more interactiveness. --> <esri:Map Background="White" Height="375" HorizontalAlignment="Left" Margin="408,227,0,0" Name="Map2" VerticalAlignment="Top" Width="375" Extent="-166.2,-57.0,-34.36,74.47" TimeExtent="1970/01/15 00:00:00 UTC,2009/01/15 00:00:00 UTC"> <esri:ArcGISTiledMapServiceLayer ID="StreetMapLayer" Url="http://services.arcgisonline.com/ArcGIS/rest/services/ESRI_StreetMap_World_2D/MapServer"/> <!-- The FeatureLayer contains earthquake events data from the USGS as Markers (aka. Points). The Where clause for the FeatureLayer is optional. The Where clause is necessary when more that 500/1000 records returned. In ArcGIS Server 9.3.1 and prior, the default maximum is 500 records returned per FeatureLayer. In ArcGIS Server 10 the default is 1000. This setting is configurable per map service using ArcCatalog or ArcGIS Server Manager (on the Parameters tab). This Where clause only displays earthquakes where one or more deaths have occurred. Specify the Outfields Property to specify which Fields are returned on which the TemporalRenderer TrackIdField can use. Specifying the wildcard (*) character in the Add Property will return all Fields. --> <esri:FeatureLayer ID="MyFeatureLayer" Url="http://sampleserver3.arcgisonline.com/ArcGIS/rest/services/Earthquakes/Since_1970/MapServer/0" Where="Num_Deaths > 1" OutFields="*"> <esri:FeatureLayer.Renderer> <!-- Create the TemporalRenderer. The TemporalRenderer will use only the ObservationRenderer Property to create the image. --> <esri:TemporalRenderer> <!-- ObservationRenderer Property: When using a ClassBreaksRenderer as the TemporalRenderer.ObservationRenderer Property, if you do not specify all of the ClassBreakInfo objects to cover all of the data observation possibilities (i.e. features returned) then those features for which there is no ClassBreakInfo will not be rendered (i.e. drawn) unless a ClassBreaksRenderer DefaultSymbol is specified. A ClassBreaksRenderer should have 2 or more ClassBreakInfo Classes (meaning classification or grouping) to delineate the different symbology and class break information. The next three sections of code define 3 different ClassBreakInfo Classes (or groups) and their associated symbology. --> <esri:TemporalRenderer.ObservationRenderer> <esri:ClassBreaksRenderer Field="Magnitude"> <!-- Define a default SimpleMarkerSymbol for a 'catch all' to draw the features for which no ClassBreaksInfo has been defined. In this example, only earthquakes with a Magnitude of 3 and greater have a defined ClassBreakInfo category and yet all earthquakes with one or more deaths will be returned. Defining a default SimpleMarkerSymbol will provide symbology for those features that have a magnitude less that 3. If a ClassBreaksRenderer DefaultSymbol was not defined these features would not be drawn on the Map. --> <esri:ClassBreaksRenderer.DefaultSymbol> <esri:SimpleMarkerSymbol Color="Green" Size="10" Style="Square"/> </esri:ClassBreaksRenderer.DefaultSymbol> <!-- A ClassBreaksRenderer should have 2 or more ClassBreakInfo Classes (meaning classification or grouping) to delineate the different symbology and class break information. The next three sections of code define 3 different ClassBreakInfo Classes (or groups) and their associated symbology. --> <!-- Group #1: Create a ClassBreakInfo object as a container of information for each group. Define the minimum and maximum values for the numeric grouping of the Field defined as the ClassBreaksRenderer Field. Add a description and label. --> <esri:ClassBreakInfo MinimumValue="4" MaximumValue="6" Description="Small yellow circles" Label="4 to 6 Magnitude"> <esri:SimpleMarkerSymbol Color="Yellow" Size="5"/> </esri:ClassBreakInfo> <!-- Group #2: Create a ClassBreakInfo object as a container of information for each group. Define the minimum and maximum values for the numeric grouping of the Field defined as the ClassBreaksRenderer Field. Add a description and label. --> <esri:ClassBreakInfo MinimumValue="6" MaximumValue="8" Description="Medium black circles" Label="6 to 8 Magnitude"> <esri:SimpleMarkerSymbol Color="Black" Size="7" /> </esri:ClassBreakInfo> <!-- Group #3: Create a ClassBreakInfo object as a container of information for each group. Define the minimum and maximum values for the numeric grouping of the Field defined as the ClassBreaksRenderer Field. Add a description and label. --> <esri:ClassBreakInfo MinimumValue="8" MaximumValue="10" Description="Large red circles" Label="8 to 10 Magnitude"> <esri:SimpleMarkerSymbol Color="Red" Size="9" /> </esri:ClassBreakInfo> </esri:ClassBreaksRenderer> </esri:TemporalRenderer.ObservationRenderer> </esri:TemporalRenderer> </esri:FeatureLayer.Renderer> </esri:FeatureLayer> </esri:Map> </Grid> | |
| C# | Copy Code |
|---|---|
public void DrawEarthquakes(ESRI.ArcGIS.Client.Map myMap2) { // Display the FeatureLayer in myMap2 that has a TemporalRenderer applied // ====================================================================== // Clear the Layers in the Map's for runs of the function. myMap2.Layers.Clear(); // Add an ArcGISTiledMapsServiceLayer as a background to the map. Note: The first Layer added to the Map's // Layers Collection is on the bottom and the other Layer is added on the top. ESRI.ArcGIS.Client.ArcGISTiledMapServiceLayer myArcGISTiledMapServiceLayer2 = new ESRI.ArcGIS.Client.ArcGISTiledMapServiceLayer(); myArcGISTiledMapServiceLayer2.Url = "http://services.arcgisonline.com/ArcGIS/rest/services/ESRI_StreetMap_World_2D/MapServer"; myMap2.Layers.Add(myArcGISTiledMapServiceLayer2); // Add a FeatureLayer to the map. Note: This Layer is drawn on top of the background layer. ESRI.ArcGIS.Client.FeatureLayer myFeatureLayer2 = new ESRI.ArcGIS.Client.FeatureLayer(); // This FeatureLayer contains historical earthquake data as Markers (aka. Points). myFeatureLayer2.Url = "http://sampleserver3.arcgisonline.com/ArcGIS/rest/services/Earthquakes/Since_1970/MapServer/0"; // The Where clause is optional. It is necessary when more that 500/1000 records returned. In ArcGIS Server // 9.3.1 and prior, the default maximum is 500 records returned per FeatureLayer. In ArcGIS Server 10 the // default is 1000. This setting is configurable per map service using ArcCatalog or ArcGIS Server Manager // (on the Parameters tab). myFeatureLayer2.Where = "Num_Deaths > 1"; //Only display earthquakes events for which 1 or more deaths have occurred. // Specify the Outfields Property to specify which Fields are returned on which the // ClassBreaksRenderer.Field can use. Specifying the wildcard (*) character in the Add Property // will return all Fields. myFeatureLayer2.OutFields.Add("*"); // Further restrict the earthquake data to just the temporal window specified. ESRI.ArcGIS.Client.TimeExtent myTimeExtent = new ESRI.ArcGIS.Client.TimeExtent(); System.DateTime dateStart = DateTime.Parse("1/15/1970"); myTimeExtent.Start = dateStart; System.DateTime dateEnd = DateTime.Parse("1/15/2009"); myTimeExtent.End = dateEnd; // Manually setting the TimeExtent of the myMap2. Could have used a TimeSlider for more inter-activeness. myMap2.TimeExtent = myTimeExtent; // Create the TemporalRenderer object. Only the ObservationRenderer will be used to create the image. ESRI.ArcGIS.Client.TemporalRenderer myTemporalRenderer = new ESRI.ArcGIS.Client.TemporalRenderer(); // When using a ClassBreaksRenderer as the TemporalRenderer.ObservationRenderer Property, if you do not // specify all of the ClassBreakInfo objects to cover all of the data observation possibilities (i.e. // features returned) then those features for which there is no ClassBreakInfo will not be // rendered (i.e. drawn) unless you set a Default symbol. // // Define a default SimpleMarkerSymbol for a 'catch all' to draw the features for which no ClassBreaksInfo // has been defined. In this example, only earthquakes with a Magnitude of 3 and greater have a defined // ClassBreakInfo category and yet all earthquakes with one or more deaths will be returned. Defining a // default SimpleMarkerSymbol will provide symbology for those features that have a magnitude less that 3. // If a ClassBreaksRenderer.DefaultSymbol was not defined these features would not be drawn on the Map. // // A ClassBreaksRenderer should have 2 or more ClassBreakInfo Classes (meaning classification or // grouping) to delineate the different symbology and class break information. The next three sections // of code define 3 different ClassBreakInfo Classes (or groups) and their associated symbology. ESRI.ArcGIS.Client.ClassBreaksRenderer myClassBreaksRenderer = new ESRI.ArcGIS.Client.ClassBreaksRenderer(); myClassBreaksRenderer.Field = "Magnitude"; // Requires a numeric Field // Define the Default symbol ESRI.ArcGIS.Client.Symbols.SimpleMarkerSymbol myDefaultMarkerSymbol = new ESRI.ArcGIS.Client.Symbols.SimpleMarkerSymbol(); System.Windows.Media.SolidColorBrush myDefaultBrush = new System.Windows.Media.SolidColorBrush(Color.FromArgb(255, 0, 255, 0)); //Green myDefaultMarkerSymbol.Color = myDefaultBrush; myDefaultMarkerSymbol.Size = 10; myDefaultMarkerSymbol.Style = ESRI.ArcGIS.Client.Symbols.SimpleMarkerSymbol.SimpleMarkerStyle.Square; myClassBreaksRenderer.DefaultSymbol = myDefaultMarkerSymbol; // Group #1 // ======== // Create a ClassBreakInfo object as a container of information for each group. ESRI.ArcGIS.Client.ClassBreakInfo myClassBreakInfo1 = new ESRI.ArcGIS.Client.ClassBreakInfo(); // Define the minimum and maximum values for the numeric grouping of the Field defined as the // ClassBreaksRenderer.Field. myClassBreakInfo1.MinimumValue = 0; myClassBreakInfo1.MaximumValue = 6; // Add an informational description and label for the group. myClassBreakInfo1.Description = "Small yellow circles"; myClassBreakInfo1.Label = "0 to 6 Magnitude"; // Each ClassBreakInfo grouping needs a symbol to display ESRI.ArcGIS.Client.Symbols.SimpleMarkerSymbol mySimpleMarkerSymbol1 = new ESRI.ArcGIS.Client.Symbols.SimpleMarkerSymbol(); System.Windows.Media.SolidColorBrush myBrush1 = new System.Windows.Media.SolidColorBrush(Color.FromArgb(255, 255, 255, 0)); //Yellow mySimpleMarkerSymbol1.Color = myBrush1; mySimpleMarkerSymbol1.Size = 5; myClassBreakInfo1.Symbol = mySimpleMarkerSymbol1; // Add the ClassBreaksInfo information to the Classes (grouping) of the ClassBreaksRenderer myClassBreaksRenderer.Classes.Add(myClassBreakInfo1); // Group #2 // ======== // Create a ClassBreakInfo object as a container of information for each group. ESRI.ArcGIS.Client.ClassBreakInfo myClassBreakInfo2 = new ESRI.ArcGIS.Client.ClassBreakInfo(); // Define the minimum and maximum values for the numeric grouping of the Field defined as the // ClassBreaksRenderer.Field. myClassBreakInfo2.MinimumValue = 6; myClassBreakInfo2.MaximumValue = 8; // Add an informational description and label for the group. myClassBreakInfo2.Description = "Medium black circles"; myClassBreakInfo2.Label = "6 to 8 Magnitude"; // Each ClassBreakInfo grouping needs a symbol to display ESRI.ArcGIS.Client.Symbols.SimpleMarkerSymbol mySimpleMarkerSymbol2 = new ESRI.ArcGIS.Client.Symbols.SimpleMarkerSymbol(); System.Windows.Media.SolidColorBrush myBrush2 = new System.Windows.Media.SolidColorBrush(Color.FromArgb(255, 0, 0, 0)); // Black mySimpleMarkerSymbol2.Color = myBrush2; mySimpleMarkerSymbol2.Size = 7; myClassBreakInfo2.Symbol = mySimpleMarkerSymbol2; // Add the ClassBreaksInfo information to the Classes (grouping) of the ClassBreaksRenderer myClassBreaksRenderer.Classes.Add(myClassBreakInfo2); // Group #3 // ======== // Create a ClassBreakInfo object as a container of information for each group. ESRI.ArcGIS.Client.ClassBreakInfo myClassBreakInfo3 = new ESRI.ArcGIS.Client.ClassBreakInfo(); // Define the minimum and maximum values for the numeric grouping of the Field defined as the // ClassBreaksRenderer.Field. myClassBreakInfo3.MinimumValue = 8; myClassBreakInfo3.MaximumValue = 10; // Add an informational description and label for the group. myClassBreakInfo3.Description = "Large red circles"; myClassBreakInfo3.Label = "8 to 10 Magnitude"; // Each ClassBreakInfo grouping needs a symbol to display ESRI.ArcGIS.Client.Symbols.SimpleMarkerSymbol mySimpleMarkerSymbol3 = new ESRI.ArcGIS.Client.Symbols.SimpleMarkerSymbol(); System.Windows.Media.SolidColorBrush myBrush3 = new System.Windows.Media.SolidColorBrush(Color.FromArgb(255, 255, 0, 0)); // Red mySimpleMarkerSymbol3.Color = myBrush3; mySimpleMarkerSymbol3.Size = 9; myClassBreakInfo3.Symbol = mySimpleMarkerSymbol3; // Add the ClassBreaksInfo information to the Classes (grouping) of the ClassBreaksRenderer myClassBreaksRenderer.Classes.Add(myClassBreakInfo3); // Now that all of the ClassBreakInfo information has been added to the ClassBreaksRenderer object, // associate the ClassBreaksRenderer with the TemporalRenderer.ObservationRenderer Property. myTemporalRenderer.ObservationRenderer = myClassBreaksRenderer; // Apply the TemporalRenderer as the Renderer of the FeatureLayer. myFeatureLayer2.Renderer = myTemporalRenderer; // Add the myFeatureLayer2 to the Map2 Layer Collection. Map2.Layers.Add(myFeatureLayer2); // Zoom to the North and South America. ESRI.ArcGIS.Client.Geometry.Envelope myEnvelope2 = new ESRI.ArcGIS.Client.Geometry.Envelope(); myEnvelope2.XMin = -166.2; myEnvelope2.YMin = -57.0; myEnvelope2.XMax = -34.36; myEnvelope2.YMax = 74.47; myMap2.Extent = myEnvelope2; } | |
| VB.NET | Copy Code |
|---|---|
Public Sub DrawEarthquakes(ByVal myMap2 As ESRI.ArcGIS.Client.Map) ' Display the FeatureLayer in myMap2 that has a TemporalRenderer applied ' ====================================================================== ' Clear the Layers in the Map's for runs of the function. myMap2.Layers.Clear() ' Add an ArcGISTiledMapsServiceLayer as a background to the map. Note: The first Layer added to the Map's ' Layers Collection is on the bottom and the other Layer is added on the top. Dim myArcGISTiledMapServiceLayer2 As New ESRI.ArcGIS.Client.ArcGISTiledMapServiceLayer myArcGISTiledMapServiceLayer2.Url = "http://services.arcgisonline.com/ArcGIS/rest/services/ESRI_StreetMap_World_2D/MapServer" myMap2.Layers.Add(myArcGISTiledMapServiceLayer2) ' Add a FeatureLayer to the map. Note: This Layer is drawn on top of the background layer. Dim myFeatureLayer2 As New ESRI.ArcGIS.Client.FeatureLayer ' This FeatureLayer contains historical earthquake data as Markers (aka. Points). myFeatureLayer2.Url = "http://sampleserver3.arcgisonline.com/ArcGIS/rest/services/Earthquakes/Since_1970/MapServer/0" ' The Where clause is optional. It is necessary when more that 500/1000 records returned. In ArcGIS Server ' 9.3.1 and prior, the default maximum is 500 records returned per FeatureLayer. In ArcGIS Server 10 the ' default is 1000. This setting is configurable per map service using ArcCatalog or ArcGIS Server Manager ' (on the Parameters tab). myFeatureLayer2.Where = "Num_Deaths > 1" 'Only display earthquakes events for which 1 or more deaths have occurred. ' Specify the Outfields Property to specify which Fields are returned on which the ' ClassBreaksRenderer.Field can use. Specifying the wildcard (*) character in the Add Property ' will return all Fields. myFeatureLayer2.OutFields.Add("*") ' Further restrict the earthquake data to just the temporal window specified. Dim myTimeExtent As New ESRI.ArcGIS.Client.TimeExtent Dim dateStart As Date = #1/15/1970# myTimeExtent.Start = dateStart Dim dateEnd As Date = #1/15/2009# myTimeExtent.End = dateEnd ' Manually setting the TimeExtent of the myMap2. Could have used a TimeSlider for more inter-activeness. myMap2.TimeExtent = myTimeExtent ' Create the TemporalRenderer object. Only the ObservationRenderer will be used to create the image. Dim myTemporalRenderer As New ESRI.ArcGIS.Client.TemporalRenderer ' When using a ClassBreaksRenderer as the TemporalRenderer.ObservationRenderer Property, if you do not ' specify all of the ClassBreakInfo objects to cover all of the data observation possibilities (i.e. ' features returned) then those features for which there is no ClassBreakInfo will not be ' rendered (i.e. drawn) unless you set a Default symbol. ' ' Define a default SimpleMarkerSymbol for a 'catch all' to draw the features for which no ClassBreaksInfo ' has been defined. In this example, only earthquakes with a Magnitude of 3 and greater have a defined ' ClassBreakInfo category and yet all earthquakes with one or more deaths will be returned. Defining a ' default SimpleMarkerSymbol will provide symbology for those features that have a magnitude less that 3. ' If a ClassBreaksRenderer.DefaultSymbol was not defined these features would not be drawn on the Map. ' ' A ClassBreaksRenderer should have 2 or more ClassBreakInfo Classes (meaning classification or ' grouping) to delineate the different symbology and class break information. The next three sections ' of code define 3 different ClassBreakInfo Classes (or groups) and their associated symbology. Dim myClassBreaksRenderer As New ESRI.ArcGIS.Client.ClassBreaksRenderer myClassBreaksRenderer.Field = "Magnitude" ' Requires a numeric Field ' Define the Default symbol Dim myDefaultMarkerSymbol As New ESRI.ArcGIS.Client.Symbols.SimpleMarkerSymbol Dim myDefaultBrush As New System.Windows.Media.SolidColorBrush(Color.FromArgb(255, 0, 255, 0)) 'Green myDefaultMarkerSymbol.Color = myDefaultBrush myDefaultMarkerSymbol.Size = 10 myDefaultMarkerSymbol.Style = ESRI.ArcGIS.Client.Symbols.SimpleMarkerSymbol.SimpleMarkerStyle.Square myClassBreaksRenderer.DefaultSymbol = myDefaultMarkerSymbol ' Group #1 ' ======== ' Create a ClassBreakInfo object as a container of information for each group. Dim myClassBreakInfo1 As New ESRI.ArcGIS.Client.ClassBreakInfo ' Define the minimum and maximum values for the numeric grouping of the Field defined as the ' ClassBreaksRenderer.Field. myClassBreakInfo1.MinimumValue = 0 myClassBreakInfo1.MaximumValue = 6 ' Add an informational description and label for the group. myClassBreakInfo1.Description = "Small yellow circles" myClassBreakInfo1.Label = "0 to 6 Magnitude" ' Each ClassBreakInfo grouping needs a symbol to display Dim mySimpleMarkerSymbol1 As New ESRI.ArcGIS.Client.Symbols.SimpleMarkerSymbol Dim myBrush1 As New System.Windows.Media.SolidColorBrush(Color.FromArgb(255, 255, 255, 0)) 'Yellow mySimpleMarkerSymbol1.Color = myBrush1 mySimpleMarkerSymbol1.Size = 5 myClassBreakInfo1.Symbol = mySimpleMarkerSymbol1 ' Add the ClassBreaksInfo information to the Classes (grouping) of the ClassBreaksRenderer myClassBreaksRenderer.Classes.Add(myClassBreakInfo1) ' Group #2 ' ======== ' Create a ClassBreakInfo object as a container of information for each group. Dim myClassBreakInfo2 As New ESRI.ArcGIS.Client.ClassBreakInfo ' Define the minimum and maximum values for the numeric grouping of the Field defined as the ' ClassBreaksRenderer.Field. myClassBreakInfo2.MinimumValue = 6 myClassBreakInfo2.MaximumValue = 8 ' Add an informational description and label for the group. myClassBreakInfo2.Description = "Medium black circles" myClassBreakInfo2.Label = "6 to 8 Magnitude" ' Each ClassBreakInfo grouping needs a symbol to display Dim mySimpleMarkerSymbol2 As New ESRI.ArcGIS.Client.Symbols.SimpleMarkerSymbol Dim myBrush2 As New System.Windows.Media.SolidColorBrush(Color.FromArgb(255, 0, 0, 0)) ' Black mySimpleMarkerSymbol2.Color = myBrush2 mySimpleMarkerSymbol2.Size = 7 myClassBreakInfo2.Symbol = mySimpleMarkerSymbol2 ' Add the ClassBreaksInfo information to the Classes (grouping) of the ClassBreaksRenderer myClassBreaksRenderer.Classes.Add(myClassBreakInfo2) ' Group #3 ' ======== ' Create a ClassBreakInfo object as a container of information for each group. Dim myClassBreakInfo3 As New ESRI.ArcGIS.Client.ClassBreakInfo ' Define the minimum and maximum values for the numeric grouping of the Field defined as the ' ClassBreaksRenderer.Field. myClassBreakInfo3.MinimumValue = 8 myClassBreakInfo3.MaximumValue = 10 ' Add an informational description and label for the group. myClassBreakInfo3.Description = "Large red circles" myClassBreakInfo3.Label = "8 to 10 Magnitude" ' Each ClassBreakInfo grouping needs a symbol to display Dim mySimpleMarkerSymbol3 As New ESRI.ArcGIS.Client.Symbols.SimpleMarkerSymbol Dim myBrush3 As New System.Windows.Media.SolidColorBrush(Color.FromArgb(255, 255, 0, 0)) ' Red mySimpleMarkerSymbol3.Color = myBrush3 mySimpleMarkerSymbol3.Size = 9 myClassBreakInfo3.Symbol = mySimpleMarkerSymbol3 ' Add the ClassBreaksInfo information to the Classes (grouping) of the ClassBreaksRenderer myClassBreaksRenderer.Classes.Add(myClassBreakInfo3) ' Now that all of the ClassBreakInfo information has been added to the ClassBreaksRenderer object, ' associate the ClassBreaksRenderer with the TemporalRenderer.ObservationRenderer Property. myTemporalRenderer.ObservationRenderer = myClassBreaksRenderer ' Apply the TemporalRenderer as the Renderer of the FeatureLayer. myFeatureLayer2.Renderer = myTemporalRenderer ' Add the myFeatureLayer2 to the Map2 Layer Collection. Map2.Layers.Add(myFeatureLayer2) ' Zoom to the North and South America. Dim myEnvelope2 As New ESRI.ArcGIS.Client.Geometry.Envelope myEnvelope2.XMin = -166.2 myEnvelope2.YMin = -57.0 myEnvelope2.XMax = -34.36 myEnvelope2.YMax = 74.47 myMap2.Extent = myEnvelope2 End Sub | |
Remarks
This default symbology of the ObservationRenderer Property can be overridden by the LatestObservationRenderer and the TrackRenderer to provide additional ways to graphically represent the features that are returned from a FeatureLayer. While it is theoretically possible to have any Renderer that Implements the IRenderer Interface be used as the ObservationRenderer Property, it typically makes sense to only use a SimpleRenderer, ClassBreaksRenderer, or UniqueValueRenderer.
By using a SimpleRenderer for the ObservationRenderer property you are assured that each feature returned from the service will be drawn on the map provided you have not exceeded the service limit. When using a ClassBreaksRenderer as the ObservationRenderer Property, if you do not specify all of the ClassBreakInfo objects to cover all of the data observation possibilities (i.e. features returned) then those features for which there is no ClassBreakInfo will not be rendered (i.e. drawn) unless a ClassBreaksRenderer.DefaultSymbol is set.
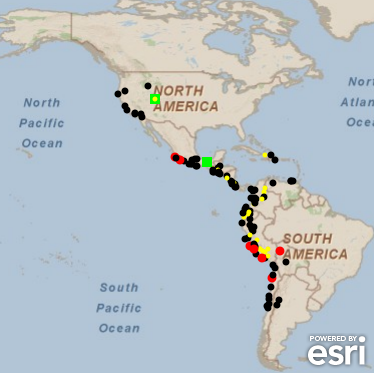
The following screen shot depicts an image of earthquakes locations from January 15, 1970 to January 15, 2009 for which at least one death occurred. Only the ObservationRenderer Property is used in the TemporalRenderer. The ObservationRenderer Property is based upon a ClassBreaksRender where the earthquake points are drawn based upon their Magnitude. The map is centered over North and South America. The yellow markers denote medium earthquakes (Magnitude 4 to 6), the black markers denote large earthquakes (Magnitude 6 to 8), and the red markers denote enormous earthquakes (Magnitude 8 to 10). A default symbol of a green square is provided to draw all earthquakes that are not defined by the other classes. The screen shot matches the code example provided in this documentation page.
Requirements
Target Platforms: Windows XP Professional, Windows Server 2003 family, Windows Vista, Windows Server 2008 family