


 Syntax
| Visual Basic (Declaration) | |
|---|---|
Public Property LatestObservationRenderer As IRenderer | |
| C# | |
|---|---|
public IRenderer LatestObservationRenderer {get; set;} | |
Example
| XAML |  Copy Code Copy Code |
|---|---|
<Grid x:Name="LayoutRoot" Background="White"> <!-- Display the FeatureLayer in myMap2 that has a TemporalRenderer applied: Add an ArcGISTiledMapsServiceLayer as a background to the map. The ArcGISTiledMapsServiceLayer layer is first Layer added to the Map's Layers Collection and is drawn on the bottom. A FeatureLayer is then added to the map and draws on top of the background layer. Set the Map2 Extent to zoom to the middle of the Atlantic ocean. Setting the Map's TimeExtent acts like a Where clause in that only those features/records that fall within the set TimeExtent will then be shown. If no Map TimeExtent is set then only the ObservationRenderer is in effect. If a Map TimeExtent is set then the ObservationRenderer and the LastObservationRenderer (and TrackRenderer if defined) are in effect. In the case of this example the TimeExtent for the hurricane Alberto is shortened to a small temporal window to display the various rendering effects clearly. Manually setting the TimeExtent of the Map2. Could have bound to a TimeSlider for more interactiveness. --> <esri:Map Background="White" Height="375" HorizontalAlignment="Left" Margin="408,227,0,0" Name="Map2" VerticalAlignment="Top" Width="375" Extent="-77.69,-13.88,-11.77,52.03" TimeExtent="2000/08/03 00:00:01 UTC,2000/08/08 06:00:01 UTC"> <esri:ArcGISTiledMapServiceLayer ID="StreetMapLayer" Url="http://services.arcgisonline.com/ArcGIS/rest/services/ESRI_StreetMap_World_2D/MapServer"/> <!-- The FeatureLayer contains Hurricane data from NOAA as Markers (aka. Points). The Where clause for the FeatureLayer is optional. The Where clause is necessary when more that 500/1000 records returned. In ArcGIS Server 9.3.1 and prior, the default maximum is 500 records returned per FeatureLayer. In ArcGIS Server 10 the default is 1000. This setting is configurable per map service using ArcCatalog or ArcGIS Server Manager (on the Parameters tab). This Where clause only displays hurricane data for Alberto. Specify the Outfields Property to specify which Fields are returned on which the TemporalRenderer TrackIdField can use. Specifying the wildcard (*) character in the Add Property will return all Fields. --> <esri:FeatureLayer ID="MyFeatureLayer" Url="http://servicesbeta.esri.com/ArcGIS/rest/services/Hurricanes/Hurricanes/MapServer/0" Where="EVENTID = 'Alberto'" OutFields="*"> <esri:FeatureLayer.Renderer> <!-- Create the TemporalRenderer. Specify which TrackIdField (via its string name) the TemporalRenderer will use for breaking the rendering of the polyline event Symbols into groups. The TemporalRenderer will use three different Properties (ObservationRenderer, LatestObservationRenderer, and TrackRenderer) to create the image. Setting the TrackIdField draws polylines in time order for a group of attributes. If the TrackIdField property is not set and the TrackRenderer is used, then all point observations will have a polyline connecting them in order of time. This becomes messy if multiple events are occurring at the same time (i.e. hurricanes) and the linework would then look like a spider diagram rather than discreet tracks with one per event. In this example to speed up drawing time and limit the amount of data that is returned, the FeatureLayer Where clause was used to restrict only one hurricane (or event) from displaying. If the FeatureLayer Where clause was commented out, multiple hurricanes would be displayed. Having the TrackIdField becomes key to keeping each event separate. --> <esri:TemporalRenderer TrackIdField="EVENTID"> <!-- ObservationRenderer Property: All features (or observations) are drawn using the ObservationRenderer unless they are overridden by another renderer (such as the LastObservationRenderer). Define a SimpleRenderer with a SimpleMarkerSymbol to display each observation. Each observation will be a small red triangle. --> <esri:TemporalRenderer.ObservationRenderer> <esri:SimpleRenderer> <esri:SimpleMarkerSymbol Color="Red" Size="5" Style="Triangle"/> </esri:SimpleRenderer> </esri:TemporalRenderer.ObservationRenderer> <!-- LatestObservationRenderer Property: If you do not want the last observation point in the returned set of features to be rendered differently then do not use the LatestObservationRenderer. If no Map2 TimeExtent is set then the LastObservationRenderer will not be drawn. Define a SimpleRenderer with a SimpleMarkerSymbol to display each observation. The last observation will be a big black dot. --> <esri:TemporalRenderer.LatestObservationRenderer> <esri:SimpleRenderer> <esri:SimpleMarkerSymbol Color="Black" Size="10"/> </esri:SimpleRenderer> </esri:TemporalRenderer.LatestObservationRenderer> <!-- TrackRenderer Property: Define a SimpleRenderer with a SimpleLineSymbol to display each tracked event. The event will be a yellow line connecting the time-based observations. --> <esri:TemporalRenderer.TrackRenderer> <esri:SimpleRenderer> <esri:SimpleLineSymbol Color="Yellow" Width="1"/> </esri:SimpleRenderer> </esri:TemporalRenderer.TrackRenderer> </esri:TemporalRenderer> </esri:FeatureLayer.Renderer> </esri:FeatureLayer> </esri:Map> </Grid> | |
| C# | Copy Code |
|---|---|
public void DrawHurricaneAlberto(ESRI.ArcGIS.Client.Map myMap2) { // Display the FeatureLayer in myMap2 that has a TemporalRenderer applied // ====================================================================== // Clear out any exiting layers myMap2.Layers.Clear(); // Add an ArcGISTiledMapsServiceLayer as a background to the map. Note: The first Layer added to the Map's // Layers Collection is on the bottom and the other Layer is added on the top. ESRI.ArcGIS.Client.ArcGISTiledMapServiceLayer myArcGISTiledMapServiceLayer2 = new ESRI.ArcGIS.Client.ArcGISTiledMapServiceLayer(); myArcGISTiledMapServiceLayer2.Url = "http://services.arcgisonline.com/ArcGIS/rest/services/ESRI_StreetMap_World_2D/MapServer"; myMap2.Layers.Add(myArcGISTiledMapServiceLayer2); // Add a FeatureLayer to the map. Note: This Layer is drawn on top of the background layer. ESRI.ArcGIS.Client.FeatureLayer myFeatureLayer2 = new ESRI.ArcGIS.Client.FeatureLayer(); // This FeatureLayer contains hurricane data from NOAA. myFeatureLayer2.Url = "http://servicesbeta.esri.com/ArcGIS/rest/services/Hurricanes/Hurricanes/MapServer/0"; // The Where clause is optional. It is necessary when more that 500/1000 records returned. In ArcGIS Server // 9.3.1 and prior, the default maximum is 500 records returned per FeatureLayer. In ArcGIS Server 10 the // default is 1000. This setting is configurable per map service using ArcCatalog or ArcGIS Server Manager // (on the Parameters tab). myFeatureLayer2.Where = "EVENTID = 'Alberto'"; //Only display hurricane data for Alberto. // Specify the Outfields Property to specify which Fields are returned on which the // TemporalRenderer.TrackIdField can use. Specifying the wildcard (*) character in the Add Property // will return all Fields. myFeatureLayer2.OutFields.Add("*"); // Setting the Map's TimeExtent acts like a Where clause in that only those features/records that fall // within the set TimeExtent will then be shown. If no Map.TimeExtent is set then only the // ObservationRenderer is in effect. If a Map.TimeExtent is set then the ObservationRenderer and the // LastObservationRenderer (and TrackRenderer if defined) are in effect. In the case of this example // the TimeExtent for the hurricane Alberto is shortened to a small temporal window to display the // various rendering effects clearly. ESRI.ArcGIS.Client.TimeExtent myTimeExtent = new ESRI.ArcGIS.Client.TimeExtent(); System.DateTime date1 = DateTime.Parse("8/3/2000 12:00:01 AM"); //Alberto Start myTimeExtent.Start = date1; System.DateTime date2 = DateTime.Parse("8/8/2000 6:00:01 AM"); //Alberto End myTimeExtent.End = date2; // Manually setting the TimeExtent of the myMap2. Could have used a TimeSlider for more interactiveness. myMap2.TimeExtent = myTimeExtent; // Create the TemporalRenderer object. It will use three different Properties (ObservationRenderer, // LatestObservationRenderer, and TrackRenderer) to create the image. ESRI.ArcGIS.Client.TemporalRenderer myTemporalRenderer = new ESRI.ArcGIS.Client.TemporalRenderer(); // ObservationRenderer Property: // ----------------------------- // All features (or observations) are drawn using the ObservationRenderer unless they are // overridden by another renderer (such as the LastObservationRenderer). // Define a SimpleRenderer with a SimpleMarkerSymbol to display each observation. Each observation // will be a small red triangle. ESRI.ArcGIS.Client.SimpleRenderer mySimpleRenderer2 = new ESRI.ArcGIS.Client.SimpleRenderer(); ESRI.ArcGIS.Client.Symbols.SimpleMarkerSymbol mySymbol2 = new ESRI.ArcGIS.Client.Symbols.SimpleMarkerSymbol(); System.Windows.Media.SolidColorBrush defaultBrush2 = new System.Windows.Media.SolidColorBrush(Color.FromArgb(255, 255, 0, 0)); //Red mySymbol2.Color = defaultBrush2; mySymbol2.Size = 5; mySymbol2.Style = ESRI.ArcGIS.Client.Symbols.SimpleMarkerSymbol.SimpleMarkerStyle.Triangle; mySimpleRenderer2.Symbol = mySymbol2; myTemporalRenderer.ObservationRenderer = mySimpleRenderer2; // LatestObservationRenderer Property: // ---------------------------------- // If you do not want the last observation point in the returned set of features to be rendered // differently then do not use the LatestObservationRenderer. If no myMap2.TimeExtent is set then // the LastObservationRenderer will not be drawn. // Define a SimpleRenderer with a SimpleMarkerSymbol to display each observation. The last // observation will be a big black dot. ESRI.ArcGIS.Client.SimpleRenderer mySimpleRenderer = new ESRI.ArcGIS.Client.SimpleRenderer(); ESRI.ArcGIS.Client.Symbols.SimpleMarkerSymbol mySymbol = new ESRI.ArcGIS.Client.Symbols.SimpleMarkerSymbol(); System.Windows.Media.SolidColorBrush defaultBrush = new System.Windows.Media.SolidColorBrush(Color.FromArgb(255, 0, 0, 0)); //Black mySymbol.Color = defaultBrush; mySymbol.Size = 10; mySimpleRenderer.Symbol = mySymbol; myTemporalRenderer.LatestObservationRenderer = mySimpleRenderer; // TrackRenderer Property: // ----------------------- // Setting the TrackIdField draws polylines in time order for a group of attributes. If the // TrackIdField property is not set and the TrackRenderer is used, then all point observations // will have a polyline connecting them in order of time. This becomes messy if multiple // events are occurring at the same time (i.e. hurricanes) and the linework would then look like // a spider diagram rather than discreet tracks with one per event. In this example to speed up // drawing time and limit the amount of data that is returned, the FeatureLayer.Where clause was // used to restrict only one hurricane (or event) from displaying. If the FeatureLayer.Where // clause was commented out, multiple hurricanes would be displayed -- having the TrackIdField // becomes key to keeping each event separate. myTemporalRenderer.TrackIdField = "EVENTID"; // Define a SimpleRenderer with a SimpleLineSymbol to display each tracked event. The event // will be a yellow line connecting the time-based observations. ESRI.ArcGIS.Client.SimpleRenderer myTrackRenderer = new ESRI.ArcGIS.Client.SimpleRenderer(); ESRI.ArcGIS.Client.Symbols.SimpleLineSymbol defaultSimpleLineSymbol3 = new ESRI.ArcGIS.Client.Symbols.SimpleLineSymbol(); System.Windows.Media.SolidColorBrush defaultBrush3 = new System.Windows.Media.SolidColorBrush(Color.FromArgb(255, 255, 255, 0)); //Yellow defaultSimpleLineSymbol3.Color = defaultBrush3; defaultSimpleLineSymbol3.Width = 1; myTrackRenderer.Symbol = defaultSimpleLineSymbol3; myTemporalRenderer.TrackRenderer = myTrackRenderer; // Apply the TemporalRenderer as the Renderer of the FeatureLayer. myFeatureLayer2.Renderer = myTemporalRenderer; // Add the myFeatureLayer2 to the myMap2 Layer Collection. Map2.Layers.Add(myFeatureLayer2); // Zoom to the middle of the Atlantic ocean. ESRI.ArcGIS.Client.Geometry.Envelope myEnvelope2 = new ESRI.ArcGIS.Client.Geometry.Envelope(); myEnvelope2.XMin = -77.69; myEnvelope2.YMin = -13.88; myEnvelope2.XMax = -11.77; myEnvelope2.YMax = 52.03; myMap2.Extent = myEnvelope2; } | |
| VB.NET | Copy Code |
|---|---|
Public Sub DrawHurricaneAlberto(ByVal myMap2 As ESRI.ArcGIS.Client.Map) ' Display the FeatureLayer in myMap2 that has a TemporalRenderer applied ' ====================================================================== ' Clear out any exiting layers myMap2.Layers.Clear() ' Add an ArcGISTiledMapsServiceLayer as a background to the map. Note: The first Layer added to the Map's ' Layers Collection is on the bottom and the other Layer is added on the top. Dim myArcGISTiledMapServiceLayer2 As New ESRI.ArcGIS.Client.ArcGISTiledMapServiceLayer myArcGISTiledMapServiceLayer2.Url = "http://services.arcgisonline.com/ArcGIS/rest/services/ESRI_StreetMap_World_2D/MapServer" myMap2.Layers.Add(myArcGISTiledMapServiceLayer2) ' Add a FeatureLayer to the map. Note: This Layer is drawn on top of the background layer. Dim myFeatureLayer2 As New ESRI.ArcGIS.Client.FeatureLayer ' This FeatureLayer contains hurricane data from NOAA. myFeatureLayer2.Url = "http://servicesbeta.esri.com/ArcGIS/rest/services/Hurricanes/Hurricanes/MapServer/0" ' The Where clause is optional. It is necessary when more that 500/1000 records returned. In ArcGIS Server ' 9.3.1 and prior, the default maximum is 500 records returned per FeatureLayer. In ArcGIS Server 10 the ' default is 1000. This setting is configurable per map service using ArcCatalog or ArcGIS Server Manager ' (on the Parameters tab). myFeatureLayer2.Where = "EVENTID = 'Alberto'" 'Only display hurricane data for Alberto. ' Specify the Outfields Property to specify which Fields are returned on which the ' TemporalRenderer.TrackIdField can use. Specifying the wildcard (*) character in the Add Property ' will return all Fields. myFeatureLayer2.OutFields.Add("*") ' Setting the Map's TimeExtent acts like a Where clause in that only those features/records that fall ' within the set TimeExtent will then be shown. If no Map.TimeExtent is set then only the ' ObservationRenderer is in effect. If a Map.TimeExtent is set then the ObservationRenderer and the ' LastObservationRenderer (and TrackRenderer if defined) are in effect. In the case of this example ' the TimeExtent for the hurricane Alberto is shortened to a small temporal window to display the ' various rendering effects clearly. Dim myTimeExtent As New ESRI.ArcGIS.Client.TimeExtent Dim date1 As Date = #8/3/2000 12:00:01 AM# 'Alberto Start myTimeExtent.Start = date1 Dim date2 As Date = #8/8/2000 6:00:01 AM# 'Alberto End myTimeExtent.End = date2 ' Manually setting the TimeExtent of the myMap2. Could have used a TimeSlider for more interactiveness. myMap2.TimeExtent = myTimeExtent ' Create the TemporalRenderer object. It will use three different Properties (ObservationRenderer, ' LatestObservationRenderer, and TrackRenderer) to create the image. Dim myTemporalRenderer As New ESRI.ArcGIS.Client.TemporalRenderer ' ObservationRenderer Property: ' ----------------------------- ' All features (or observations) are drawn using the ObservationRenderer unless they are ' overridden by another renderer (such as the LastObservationRenderer). ' Define a SimpleRenderer with a SimpleMarkerSymbol to display each observation. Each observation ' will be a small red triangle. Dim mySimpleRenderer2 As New ESRI.ArcGIS.Client.SimpleRenderer Dim mySymbol2 As New ESRI.ArcGIS.Client.Symbols.SimpleMarkerSymbol Dim defaultBrush2 As New System.Windows.Media.SolidColorBrush(Color.FromArgb(255, 255, 0, 0)) 'Red mySymbol2.Color = defaultBrush2 mySymbol2.Size = 5 mySymbol2.Style = ESRI.ArcGIS.Client.Symbols.SimpleMarkerSymbol.SimpleMarkerStyle.Triangle mySimpleRenderer2.Symbol = mySymbol2 myTemporalRenderer.ObservationRenderer = mySimpleRenderer2 ' LatestObservationRenderer Property: ' ---------------------------------- ' If you do not want the last observation point in the returned set of features to be rendered ' differently then do not use the LatestObservationRenderer. If no myMap2.TimeExtent is set then ' the LastObservationRenderer will not be drawn. ' Define a SimpleRenderer with a SimpleMarkerSymbol to display each observation. The last ' observation will be a big black dot. Dim mySimpleRenderer As New ESRI.ArcGIS.Client.SimpleRenderer Dim mySymbol As New ESRI.ArcGIS.Client.Symbols.SimpleMarkerSymbol Dim defaultBrush As New System.Windows.Media.SolidColorBrush(Color.FromArgb(255, 0, 0, 0)) 'Black mySymbol.Color = defaultBrush mySymbol.Size = 10 mySimpleRenderer.Symbol = mySymbol myTemporalRenderer.LatestObservationRenderer = mySimpleRenderer ' TrackRenderer Property: ' ----------------------- ' Setting the TrackIdField draws polylines in time order for a group of attributes. If the ' TrackIdField property is not set and the TrackRenderer is used, then all point observations ' will have a polyline connecting them in order of time. This becomes messy if multiple ' events are occurring at the same time (i.e. hurricanes) and the linework would then look like ' a spider diagram rather than discreet tracks with one per event. In this example to speed up ' drawing time and limit the amount of data that is returned, the FeatureLayer.Where clause was ' used to restrict only one hurricane (or event) from displaying. If the FeatureLayer.Where ' clause was commented out, multiple hurricanes would be displayed -- having the TrackIdField ' becomes key to keeping each event separate. myTemporalRenderer.TrackIdField = "EVENTID" ' Define a SimpleRenderer with a SimpleLineSymbol to display each tracked event. The event ' will be a yellow line connecting the time-based observations. Dim myTrackRenderer As New ESRI.ArcGIS.Client.SimpleRenderer Dim defaultSimpleLineSymbol3 As New ESRI.ArcGIS.Client.Symbols.SimpleLineSymbol Dim defaultBrush3 As New System.Windows.Media.SolidColorBrush(Color.FromArgb(255, 255, 255, 0)) 'Yellow defaultSimpleLineSymbol3.Color = defaultBrush3 defaultSimpleLineSymbol3.Width = 1 myTrackRenderer.Symbol = defaultSimpleLineSymbol3 myTemporalRenderer.TrackRenderer = myTrackRenderer ' Apply the TemporalRenderer as the Renderer of the FeatureLayer. myFeatureLayer2.Renderer = myTemporalRenderer ' Add the myFeatureLayer2 to the myMap2 Layer Collection. Map2.Layers.Add(myFeatureLayer2) ' Zoom to the middle of the Atlantic ocean. Dim myEnvelope2 As New ESRI.ArcGIS.Client.Geometry.Envelope myEnvelope2.XMin = -77.69 myEnvelope2.YMin = -13.88 myEnvelope2.XMax = -11.77 myEnvelope2.YMax = 52.03 myMap2.Extent = myEnvelope2 End Sub | |
Remarks
Whatever symbology properties that have been set (for example: a Symbol’s Color, Size, and Style) for the LatestObservationRenderer will override what was set for the ObservationRenderer. While it is theoretically possible to have any Renderer that Implements the IRenderer Interface be used as the LastObservationRenderer Property, it typically makes sense to only use a SimpleRenderer, ClassBreaksRenderer, or UniqueValueRenderer.
It is not mandatory to have the LastObservationRenderer set when using a TemporalRenderer. If no LastObservatonRenderer is supplied then whatever is the set at the ObservationRenderer will display at the last feature provided by the service.
In order for the LastObservationRenderer to be displayed on the map, it is required that the Map.TimeExtent Property be specified. If the Map.TimeExtent Property is not specified, whatever is set for the ObservationRenderer will be used for the last feature provided by the service.
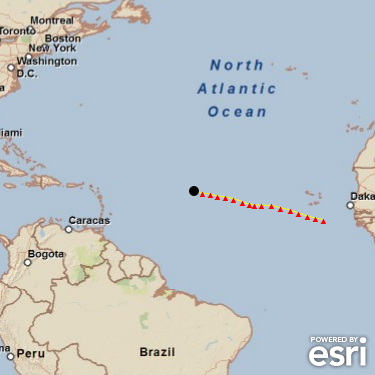
The following screen shot depicts an image of hurricane Alberto moving from West to East across the Atlantic Ocean. The red triangles are defined as the features drawn by the ObservationRenderer. The yellow polyline is defined as the path movement between the time-based features drawn by the TrackRenderer. The solid black circle is the last known point (as of this image’s rendering) drawn by the LastObservationRenderer. The screen shot matches the code example provided in this documentation page.
Requirements
Target Platforms: Windows XP Professional, Windows Server 2003 family, Windows Vista, Windows Server 2008 family