


 Object Model
Syntax
| Visual Basic (Declaration) | |
|---|---|
Public Class RampInterpolator Implements ISymbolInterpolator | |
| C# | |
|---|---|
public class RampInterpolator : ISymbolInterpolator | |
Example
| XAML |  Copy Code Copy Code |
|---|---|
<Grid x:Name="LayoutRoot" Background="White"> <!-- Display the FeatureLayer in myMap2 that has a TemporalRenderer applied: Add an ArcGISTiledMapsServiceLayer as a background to the map. The ArcGISTiledMapsServiceLayer layer is first Layer added to the Map's Layers Collection and is drawn on the bottom. A FeatureLayer is then added to the map and draws on top of the background layer. Set the Map2 Extent to zoom to the North and South America. Setting the Map's TimeExtent acts like a Where clause in that only those features/records that fall within the set TimeExtent will then be shown. In the case of this example the TimeExtent for the earthquakes is shortened to a smaller temporal window to display the various rendering effects clearly. Manually setting the TimeExtent of the Map2. Could have bound to a TimeSlider for more interactiveness. --> <esri:Map Background="White" Height="375" HorizontalAlignment="Left" Margin="408,227,0,0" Name="Map2" VerticalAlignment="Top" Width="375" Extent="-166.2,-57.0,-34.36,74.47" TimeExtent="1970/01/15 00:00:00 UTC,2000/01/15 00:00:00 UTC"> <esri:ArcGISTiledMapServiceLayer ID="StreetMapLayer" Url="http://services.arcgisonline.com/ArcGIS/rest/services/ESRI_StreetMap_World_2D/MapServer"/> <!-- The FeatureLayer contains earthquake events data from the USGS as Markers (aka. Points). The Where clause for the FeatureLayer is optional. The Where clause is necessary when more that 500/1000 records returned. In ArcGIS Server 9.3.1 and prior, the default maximum is 500 records returned per FeatureLayer. In ArcGIS Server 10 the default is 1000. This setting is configurable per map service using ArcCatalog or ArcGIS Server Manager (on the Parameters tab). This Where clause only displays earthquakes where one or more deaths have occurred. --> <esri:FeatureLayer ID="MyFeatureLayer" Url="http://sampleserver3.arcgisonline.com/ArcGIS/rest/services/Earthquakes/Since_1970/MapServer/0" Where="Num_Deaths > 1"> <esri:FeatureLayer.Renderer> <!-- Create the TemporalRenderer. --> <esri:TemporalRenderer> <!-- ObservationRenderer Property: Define the default symbology for the FeatureLayer.TemporalRenderer.ObservationRenderer. Use a SimpleRenderer so that each temporal observation has some type of symbology. Only need to specify the Symbol.Style property (a triangle). There is no need to specify the Symbol.Color or Symbol.Size as a RampInterpolator will be used to graduate the symbology across the specified temporal window (i.e. Map.TimeExtent). --> <esri:TemporalRenderer.ObservationRenderer> <esri:SimpleRenderer> <esri:SimpleMarkerSymbol Style="Triangle"/> </esri:SimpleRenderer> </esri:TemporalRenderer.ObservationRenderer> <!-- SymbolAger Property: The default symbol specified by the ObservationRenderer will have the color and size ramped across the Map.TimeExtent specified. In this example code: newer earthquakes will be shown as triangles that are large and red. The oldest earthquakes will be trinagles that are small and green. An automatic ramping of the triangle's color and size will occur automatically over the temporal period. --> <esri:TemporalRenderer.SymbolAger> <esri:RampInterpolator> <esri:RampInterpolator.ColorRange> <esri:ColorRange From="Red" To="Green"/> </esri:RampInterpolator.ColorRange> <esri:RampInterpolator.SizeRange> <esri:SizeRange From="20" To="5"/> </esri:RampInterpolator.SizeRange> </esri:RampInterpolator> </esri:TemporalRenderer.SymbolAger> </esri:TemporalRenderer> </esri:FeatureLayer.Renderer> </esri:FeatureLayer> </esri:Map> </Grid> | |
| C# | Copy Code |
|---|---|
public void DrawRampInterpolator(ESRI.ArcGIS.Client.Map myMap) { // Display the FeatureLayer in myMap that has a TemporalRenderer applied // ===================================================================== // Clear the Layers in the Map's for runs of the function. myMap.Layers.Clear(); // Add an ArcGISTiledMapsServiceLayer as a background to the map. Note: The first Layer added to the Map's // Layers Collection is on the bottom and the other Layer is added on the top. ESRI.ArcGIS.Client.ArcGISTiledMapServiceLayer myArcGISTiledMapServiceLayer2 = new ESRI.ArcGIS.Client.ArcGISTiledMapServiceLayer(); myArcGISTiledMapServiceLayer2.Url = "http://services.arcgisonline.com/ArcGIS/rest/services/ESRI_StreetMap_World_2D/MapServer"; myMap.Layers.Add(myArcGISTiledMapServiceLayer2); // Add a FeatureLayer to the map. Note: This Layer is drawn on top of the background layer. ESRI.ArcGIS.Client.FeatureLayer myFeatureLayer = new ESRI.ArcGIS.Client.FeatureLayer(); // This FeatureLayer contains historical earthquake data as Markers (aka. Points). myFeatureLayer.Url = "http://sampleserver3.arcgisonline.com/ArcGIS/rest/services/Earthquakes/Since_1970/MapServer/0"; // The Where clause is optional. It is necessary when more that 500/1000 records returned. In ArcGIS Server // 9.3.1 and prior, the default maximum is 500 records returned per FeatureLayer. In ArcGIS Server 10 the // default is 1000. This setting is configurable per map service using ArcCatalog or ArcGIS Server Manager // (on the Parameters tab). myFeatureLayer.Where = "Num_Deaths > 1"; //Only display earthquakes events for which 1 or more deaths have occurred. // Further restrict the earthquake data to just the temporal window specified. ESRI.ArcGIS.Client.TimeExtent myTimeExtent = new ESRI.ArcGIS.Client.TimeExtent(); System.DateTime dateStart = DateTime.Parse("1/15/1970"); myTimeExtent.Start = dateStart; System.DateTime dateEnd = DateTime.Parse("1/15/2000"); myTimeExtent.End = dateEnd; // Manually setting the TimeExtent of the myMap. Could have used a TimeSlider for more inter-activeness. myMap.TimeExtent = myTimeExtent; // Create the TemporalRenderer object. ESRI.ArcGIS.Client.TemporalRenderer myTemporalRenderer = new ESRI.ArcGIS.Client.TemporalRenderer(); // Define the default symbology for the FeatureLayer.TemporalRenderer.ObservationRenderer. Use a SimpleRenderer // so that each temporal observation has some type of symbology. Only need to specify the Symbol.Style property // (a triangle). There is no need to specify the Symbol.Color or Symbol.Size as a RampInterpolator will be used // to graduate the symbology across the specified temporal window (i.e. Map.TimeExtent). ESRI.ArcGIS.Client.SimpleRenderer mySimpleRenderer = new ESRI.ArcGIS.Client.SimpleRenderer(); ESRI.ArcGIS.Client.Symbols.SimpleMarkerSymbol mySimpleMarkerSymbol = new ESRI.ArcGIS.Client.Symbols.SimpleMarkerSymbol(); mySimpleMarkerSymbol.Style = ESRI.ArcGIS.Client.Symbols.SimpleMarkerSymbol.SimpleMarkerStyle.Triangle; // NOTE: you could uncomment the next three lines but it will not make a difference in the FeatureLayer's // rendering because the RampInterpolator will override the Symbol.Color and Symbol.Size. //Dim mySolidColorBrush As New System.Windows.Media.SolidColorBrush(Color.FromArgb(255, 255, 255, 0)) 'Yellow //mySimpleMarkerSymbol.Color = mySolidColorBrush //mySimpleMarkerSymbol.Size = 7 // Apply the default symbology to the ObservationRenderer mySimpleRenderer.Symbol = mySimpleMarkerSymbol; myTemporalRenderer.ObservationRenderer = mySimpleRenderer; // Use a RampInterpolator for the SymbolAger. The default symbol specified by the ObservationRenderer // will have the color and size ramped across the Map.TimeExtent specified. // In this example code: newer earthquakes will be shown as triangles that are large and red. The oldest // earthquakes will be triangles that are small and green. An automatic ramping of the triangle's color // and size will occur automatically over the temporal period. ESRI.ArcGIS.Client.RampInterpolator myRampInterpolator = new ESRI.ArcGIS.Client.RampInterpolator(); ESRI.ArcGIS.Client.ColorRange myColorRange = new ESRI.ArcGIS.Client.ColorRange(); myColorRange.From = Color.FromArgb(255, 255, 0, 0); //Red myColorRange.To = Color.FromArgb(255, 0, 255, 0); //Green myRampInterpolator.ColorRange = myColorRange; ESRI.ArcGIS.Client.SizeRange mySizeRange = new ESRI.ArcGIS.Client.SizeRange(); mySizeRange.From = 20; mySizeRange.To = 5; myRampInterpolator.SizeRange = mySizeRange; // You could also specify an opacity (i.e. amount of visibility) for the triangles as well. Uncomment // the next three lines to see this effect. //Dim myOpacityRange As New ESRI.ArcGIS.Client.OpacityRange //myOpacityRange.From = 1 '1 = solid //myOpacityRange.To = 0.1 '0 = invisible //myRampInterpolator.OpacityRange = myOpacityRange // Apply the RampInterpolator as the TemporalRenderer.SymbolAger myTemporalRenderer.SymbolAger = myRampInterpolator; // Apply the TemporalRenderer as the Renderer of the FeatureLayer. myFeatureLayer.Renderer = myTemporalRenderer; // Add the myFeatureLayer to the myMap Layer Collection. myMap.Layers.Add(myFeatureLayer); // Zoom to the North and South America. ESRI.ArcGIS.Client.Geometry.Envelope myEnvelope2 = new ESRI.ArcGIS.Client.Geometry.Envelope(); myEnvelope2.XMin = -166.2; myEnvelope2.YMin = -57.0; myEnvelope2.XMax = -34.36; myEnvelope2.YMax = 74.47; myMap.Extent = myEnvelope2; } | |
| VB.NET | Copy Code |
|---|---|
Public Sub DrawRampInterpolator(ByVal myMap As ESRI.ArcGIS.Client.Map) ' Display the FeatureLayer in myMap that has a TemporalRenderer applied ' ===================================================================== ' Clear the Layers in the Map's for runs of the function. myMap.Layers.Clear() ' Add an ArcGISTiledMapsServiceLayer as a background to the map. Note: The first Layer added to the Map's ' Layers Collection is on the bottom and the other Layer is added on the top. Dim myArcGISTiledMapServiceLayer2 As New ESRI.ArcGIS.Client.ArcGISTiledMapServiceLayer myArcGISTiledMapServiceLayer2.Url = "http://services.arcgisonline.com/ArcGIS/rest/services/ESRI_StreetMap_World_2D/MapServer" myMap.Layers.Add(myArcGISTiledMapServiceLayer2) ' Add a FeatureLayer to the map. Note: This Layer is drawn on top of the background layer. Dim myFeatureLayer As New ESRI.ArcGIS.Client.FeatureLayer ' This FeatureLayer contains historical earthquake data as Markers (aka. Points). myFeatureLayer.Url = "http://sampleserver3.arcgisonline.com/ArcGIS/rest/services/Earthquakes/Since_1970/MapServer/0" ' The Where clause is optional. It is necessary when more that 500/1000 records returned. In ArcGIS Server ' 9.3.1 and prior, the default maximum is 500 records returned per FeatureLayer. In ArcGIS Server 10 the ' default is 1000. This setting is configurable per map service using ArcCatalog or ArcGIS Server Manager ' (on the Parameters tab). myFeatureLayer.Where = "Num_Deaths > 1" 'Only display earthquakes events for which 1 or more deaths have occurred. ' Further restrict the earthquake data to just the temporal window specified. Dim myTimeExtent As New ESRI.ArcGIS.Client.TimeExtent Dim dateStart As Date = #1/15/1970# myTimeExtent.Start = dateStart Dim dateEnd As Date = #1/15/2000# myTimeExtent.End = dateEnd ' Manually setting the TimeExtent of the myMap. Could have used a TimeSlider for more inter-activeness. myMap.TimeExtent = myTimeExtent ' Create the TemporalRenderer object. Dim myTemporalRenderer As New ESRI.ArcGIS.Client.TemporalRenderer ' Define the default symbology for the FeatureLayer.TemporalRenderer.ObservationRenderer. Use a SimpleRenderer ' so that each temporal observation has some type of symbology. Only need to specify the Symbol.Style property ' (a triangle). There is no need to specify the Symbol.Color or Symbol.Size as a RampInterpolator will be used ' to graduate the symbology across the specified temporal window (i.e. Map.TimeExtent). Dim mySimpleRenderer As New ESRI.ArcGIS.Client.SimpleRenderer Dim mySimpleMarkerSymbol As New ESRI.ArcGIS.Client.Symbols.SimpleMarkerSymbol mySimpleMarkerSymbol.Style = ESRI.ArcGIS.Client.Symbols.SimpleMarkerSymbol.SimpleMarkerStyle.Triangle ' NOTE: you could uncomment the next three lines but it will not make a difference in the FeatureLayer's ' rendering because the RampInterpolator will override the Symbol.Color and Symbol.Size. 'Dim mySolidColorBrush As New System.Windows.Media.SolidColorBrush(Color.FromArgb(255, 255, 255, 0)) 'Yellow 'mySimpleMarkerSymbol.Color = mySolidColorBrush 'mySimpleMarkerSymbol.Size = 7 ' Apply the default symbology to the ObservationRenderer mySimpleRenderer.Symbol = mySimpleMarkerSymbol myTemporalRenderer.ObservationRenderer = mySimpleRenderer ' Use a RampInterpolator for the SymbolAger. The default symbol specified by the ObservationRenderer ' will have the color and size ramped across the Map.TimeExtent specified. ' In this example code: newer earthquakes will be shown as triangles that are large and red. The oldest ' earthquakes will be triangles that are small and green. An automatic ramping of the triangle's color ' and size will occur automatically over the temporal period. Dim myRampInterpolator As New ESRI.ArcGIS.Client.RampInterpolator Dim myColorRange As New ESRI.ArcGIS.Client.ColorRange myColorRange.From = Color.FromArgb(255, 255, 0, 0) 'Red myColorRange.To = Color.FromArgb(255, 0, 255, 0) 'Green myRampInterpolator.ColorRange = myColorRange Dim mySizeRange As New ESRI.ArcGIS.Client.SizeRange mySizeRange.From = 20 mySizeRange.To = 5 myRampInterpolator.SizeRange = mySizeRange ' You could also specify an opacity (i.e. amount of visibility) for the triangles as well. Uncomment ' the next three lines to see this effect. 'Dim myOpacityRange As New ESRI.ArcGIS.Client.OpacityRange 'myOpacityRange.From = 1 '1 = solid 'myOpacityRange.To = 0.1 '0 = invisible 'myRampInterpolator.OpacityRange = myOpacityRange ' Apply the RampInterpolator as the TemporalRenderer.SymbolAger myTemporalRenderer.SymbolAger = myRampInterpolator ' Apply the TemporalRenderer as the Renderer of the FeatureLayer. myFeatureLayer.Renderer = myTemporalRenderer ' Add the myFeatureLayer to the myMap Layer Collection. myMap.Layers.Add(myFeatureLayer) ' Zoom to the North and South America. Dim myEnvelope2 As New ESRI.ArcGIS.Client.Geometry.Envelope myEnvelope2.XMin = -166.2 myEnvelope2.YMin = -57.0 myEnvelope2.XMax = -34.36 myEnvelope2.YMax = 74.47 myMap.Extent = myEnvelope2 End Sub | |
Remarks
The RampInterpolator will modify the rendering of the entire set of features and graduate the symbology based upon the set properties. The RampInterpolator overrides the default symbology that is specified for the ObservationRenderer Property of a TemporalRenderer. The Style of the default symbol does not change during the ramping process; only the Color, Size, and Opacity of the symbol change as part of the RampInterpolator. The LatestObservationRenderer of the TemporalRenderer is not overridden by the RampInterpolator.
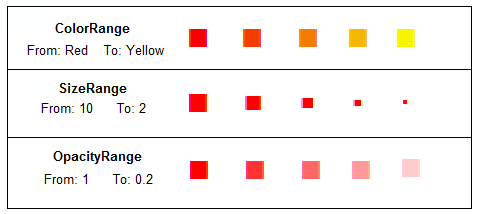
The following image provides a visual example of how a square Symbol would look via the RampInterpolator for the properties of ColorRange, SizeRange, and OpacityRange that is graduated over five time periods as defined by the Map.TimeExtent.
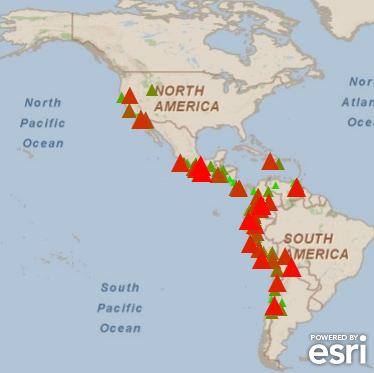
The following screen shot depicts earthquakes from 1970 to 2000 where at least one death has occurred. The default symbol that is specified for the ObservationRenderer is a triangle. Newest earthquakes will be shown as triangles that are large and red. The oldest earthquakes will be triangles that are small and green. An automatic ramping of the triangle's color and size will occur over the temporal period. The screen shot corresponds to the example code in this document.
Inheritance Hierarchy
System.Object
ESRI.ArcGIS.Client.RampInterpolator
Requirements
Target Platforms: Windows XP Professional, Windows Server 2003 family, Windows Vista, Windows Server 2008 family