


 Syntax
| Visual Basic (Declaration) | |
|---|---|
Public Property TrackRenderer As IRenderer | |
| C# | |
|---|---|
public IRenderer TrackRenderer {get; set;} | |
Example
| XAML |  Copy Code Copy Code |
|---|---|
<Grid x:Name="LayoutRoot" Background="White"> <!-- Display the FeatureLayer in myMap2 that has a TemporalRenderer applied: Add an ArcGISTiledMapsServiceLayer as a background to the map. The ArcGISTiledMapsServiceLayer layer is first Layer added to the Map's Layers Collection and is drawn on the bottom. A FeatureLayer is then added to the map and draws on top of the background layer. Set the Map2 Extent to zoom to the middle of the Atlantic ocean. Setting the Map's TimeExtent acts like a Where clause in that only those features/records that fall within the set TimeExtent will then be shown. If no Map TimeExtent is set then only the ObservationRenderer is in effect. If a Map TimeExtent is set then the ObservationRenderer and the TrackRenderer are in effect. In the case of this example the TimeExtent for the hurricane information is shortened to a small temporal window that just covers the time extent necessary to render the four hurricanes (Alberto, Isaac, Michael, and Nadine) that are returned by the service. Manually setting the TimeExtent of the Map2. Could have bound to a TimeSlider for more interactiveness. --> <esri:Map Background="White" Height="375" HorizontalAlignment="Left" Margin="408,227,0,0" Name="Map2" VerticalAlignment="Top" Width="375" Extent="-77.69,-13.88,-11.77,52.03" TimeExtent="2000/08/01 00:00:01 UTC,2000/10/25 06:00:01 UTC"> <esri:ArcGISTiledMapServiceLayer ID="StreetMapLayer" Url="http://services.arcgisonline.com/ArcGIS/rest/services/ESRI_StreetMap_World_2D/MapServer"/> <!-- The FeatureLayer contains Hurricane data from NOAA as Markers (aka. Points). The Where clause is optional. It is necessary when more that 500/1000 records returned. In ArcGIS Server 9.3.1 and prior, the default maximum is 500 records returned per FeatureLayer. In ArcGIS Server 10 the default is 1000. This setting is configurable per map service using ArcCatalog or ArcGIS Server Manager (on the Parameters tab). The Where clases gets all hurricanes that contain the letter 'A' (upper or lower case). Only four hurricanes (Alberto, Isaac, Michael, and Nadine) are returned given this syntax. Specify the Outfields Property to specify which Fields are returned on which the TemporalRenderer TrackIdField can use. Specifying the wildcard (*) character in the Add Property will return all Fields. --> <esri:FeatureLayer ID="MyFeatureLayer" Url= "http://servicesbeta.esri.com/ArcGIS/rest/services/Hurricanes/Hurricanes/MapServer/0" Where= "EVENTID LIKE 'A' OR EVENTID LIKE 'a'" OutFields="*"> <esri:FeatureLayer.Renderer> <!-- Create the TemporalRenderer object. It will use two different Properties (ObservationRenderer, and TrackRenderer) to create the image. Specify which TrackIdField (via its string name) the TemporalRenderer will use for breaking the rendering of the polyline event Symbols into groups. Setting the TrackIdField draws polylines in time order for a group of attributes. If the TrackIdField property is not set and the TrackRenderer is used, then all point observations will have a polyline connecting them in order of time. This becomes messy if multiple events are occurring at the same time (i.e. hurricanes) and the linework would then look like a spider diagram rather than discreet tracks with one per event. In this example to speed up drawing time and limit the amount of data that is returned, the FeatureLayer Where clause was used to restrict only four hurricanes (or event) from displaying. If the FeatureLayer Where clause was commented out, more hurricanes would be displayed. Having the TrackIdField becomes key to keeping each event separate. --> <esri:TemporalRenderer TrackIdField="EVENTID"> <!-- ObservationRenderer Property: When using a UniqueValueRenderer as the TemporalRenderer.ObservationRenderer Property, if you do not specify all of the UniqueValueInfo objects to cover all of the data observation possibilities (i.e. features returned) then those features for which there is no UniqueValueInfo will not be rendered (i.e. drawn) unless you set a Default symbol. Define a default SimpleMarkerSymbol for a 'catch all' to draw the features for which no UniqueValueInfo has been defined. In this example, there are four hurricanes that are returned as a result of the Where clause, they are: Alberto, Isaac, Michael, and Nadine. Yet only three UniqueValueInfo objects have been defined to render the hurricane movements, they are: Alberto, Isaac, and Michael. A UniqueValueInfo has been intentionally left our for hurricane Nadine. Defining a default SimpleMarkerSymbol will provide symbology for those features that are returned for Nadine. If a UniqueValueRenderer.DefaultSymbol was not defined, the features for Nadine would not be drawn on the Map. A UniqueValueRenderer should have 2 or more UniqueValueInfo Classes (meaning classification or grouping) to delineate the different symbology and class break information. The next three sections of code define 3 different UniqueValueInfo Classes (or groups) and their associated symbology. For the UniqueValueRenderer define a Default symbol. Create a UniqueValueInfo object as a container of information for each group. the value that contains the grouping of the Field defined as the UniqueValueRenderer.Field. Add an informational description and label for the group. Each UniqueValueInfo grouping needs a symbol to display. --> <esri:TemporalRenderer.ObservationRenderer> <esri:UniqueValueRenderer Field="EVENTID"> <esri:UniqueValueRenderer.DefaultSymbol> <esri:SimpleMarkerSymbol Color="Black" Size="5"/> </esri:UniqueValueRenderer.DefaultSymbol> <esri:UniqueValueInfo Value="Alberto"> <esri:SimpleMarkerSymbol Color="Red" Size="5"/> </esri:UniqueValueInfo> <esri:UniqueValueInfo Value="Isaac"> <esri:SimpleMarkerSymbol Color="Green" Size="5"/> </esri:UniqueValueInfo> <esri:UniqueValueInfo Value="Michael"> <esri:SimpleMarkerSymbol Color="Blue" Size="5"/> </esri:UniqueValueInfo> </esri:UniqueValueRenderer> </esri:TemporalRenderer.ObservationRenderer> <!-- TrackRenderer Property: Define a SimpleRenderer with a SimpleLineSymbol to display each tracked event. The event will be a white line connecting the time-based observations. --> <esri:TemporalRenderer.TrackRenderer> <esri:SimpleRenderer> <esri:SimpleLineSymbol Color="White" Width="1"/> </esri:SimpleRenderer> </esri:TemporalRenderer.TrackRenderer> </esri:TemporalRenderer> </esri:FeatureLayer.Renderer> </esri:FeatureLayer> </esri:Map> </Grid> | |
| C# | Copy Code |
|---|---|
public void DrawHurricanesMultiple_TrackRenderer(ESRI.ArcGIS.Client.Map myMap2) { // Display the FeatureLayer in myMap2 that has a TemporalRenderer applied // ====================================================================== // Clear out any exiting layers myMap2.Layers.Clear(); // Add an ArcGISTiledMapsServiceLayer as a background to the map. Note: The first Layer added to the Map's // Layers Collection is on the bottom and the other Layer is added on the top. ESRI.ArcGIS.Client.ArcGISTiledMapServiceLayer myArcGISTiledMapServiceLayer2 = new ESRI.ArcGIS.Client.ArcGISTiledMapServiceLayer(); myArcGISTiledMapServiceLayer2.Url = "http://services.arcgisonline.com/ArcGIS/rest/services/ESRI_StreetMap_World_2D/MapServer"; myMap2.Layers.Add(myArcGISTiledMapServiceLayer2); // Add a FeatureLayer to the map. Note: This Layer is drawn on top of the background layer. ESRI.ArcGIS.Client.FeatureLayer myFeatureLayer2 = new ESRI.ArcGIS.Client.FeatureLayer(); // This FeatureLayer contains hurricane data from NOAA. myFeatureLayer2.Url = "http://servicesbeta.esri.com/ArcGIS/rest/services/Hurricanes/Hurricanes/MapServer/0"; // The Where clause is optional. It is necessary when more that 500/1000 records returned. In ArcGIS Server // 9.3.1 and prior, the default maximum is 500 records returned per FeatureLayer. In ArcGIS Server 10 the // default is 1000. This setting is configurable per map service using ArcCatalog or ArcGIS Server Manager // (on the Parameters tab). // Only four hurricanes (Alberto, Isaac, Michael, and Nadine) are returned for this Where clause. myFeatureLayer2.Where = "EVENTID LIKE 'A' OR EVENTID LIKE 'a'"; //Get all hurricanes that contain the letter 'A' (upper or lower case). // Specify the Outfields Property to specify which Fields are returned on which the // TemporalRenderer.TrackIdField can use. Specifying the wildcard (*) character in the Add Property // will return all Fields. myFeatureLayer2.OutFields.Add("*"); // Setting the Map's TimeExtent acts like a Where clause in that only those features/records that fall // within the set TimeExtent will then be shown. If no Map.TimeExtent is set then only the // ObservationRenderer is in effect. If a Map.TimeExtent is set then the ObservationRenderer and the // TrackRenderer are in effect. In the case of this example the TimeExtent for the hurricane // information is shortened to a small temporal window that just covers the time extent necessary to // render the four hurricanes (Alberto, Isaac, Michael, and Nadine) that are returned by the service. ESRI.ArcGIS.Client.TimeExtent myTimeExtent = new ESRI.ArcGIS.Client.TimeExtent(); System.DateTime date1 = DateTime.Parse("8/1/2000 12:00:01 AM"); //Custom Start date/time myTimeExtent.Start = date1; System.DateTime date2 = DateTime.Parse("10/25/2000 12:00:01 AM"); //Custom End date/time myTimeExtent.End = date2; // Manually setting the TimeExtent of the myMap2. Could have used a TimeSlider for more interactiveness. myMap2.TimeExtent = myTimeExtent; // Create the TemporalRenderer object. It will use two different Properties (ObservationRenderer, // and TrackRenderer) to create the image. ESRI.ArcGIS.Client.TemporalRenderer myTemporalRenderer = new ESRI.ArcGIS.Client.TemporalRenderer(); // When using a UniqueValueRenderer as the TemporalRenderer.ObservationRenderer Property, if you do not // specify all of the UniqueValueInfo objects to cover all of the data observation possibilities (i.e. // features returned) then those features for which there is no UniqueValueInfo will not be // rendered (i.e. drawn) unless you set a Default symbol. // // Define a default SimpleMarkerSymbol for a 'catch all' to draw the features for which no UniqueValueInfo // has been defined. In this example, there are four hurricanes that are returned as a result of the Where // clause, they are: Alberto, Isaac, Michael, and Nadine. Yet only three UniqueValueInfo objects have been // defined to render the hurricane movements, they are: Alberto, Isaac, and Michael. A UniqueValueInfo // has been intentionally left our for hurricane Nadine. Defining a default SimpleMarkerSymbol will provide // symbology for those features that are returned for Nadine. // If a UniqueValueRenderer.DefaultSymbol was not defined, the features for Nadine would not be drawn on // the Map. // // A UniqueValueRenderer should have 2 or more UniqueValueInfo Classes (meaning classification or // grouping) to delineate the different symbology and class break information. The next three sections // of code define 3 different UniqueValueInfo Classes (or groups) and their associated symbology. ESRI.ArcGIS.Client.UniqueValueRenderer myUniqueValueRenderer = new ESRI.ArcGIS.Client.UniqueValueRenderer(); myUniqueValueRenderer.Field = "EVENTID"; //Name of the hurricanes // Define the Default symbol ESRI.ArcGIS.Client.Symbols.SimpleMarkerSymbol myDefaultSimpleMarkerSymbol = new ESRI.ArcGIS.Client.Symbols.SimpleMarkerSymbol(); System.Windows.Media.SolidColorBrush mySolidColorBrush = new System.Windows.Media.SolidColorBrush(Color.FromArgb(255, 0, 0, 0)); //Black myDefaultSimpleMarkerSymbol.Color = mySolidColorBrush; myDefaultSimpleMarkerSymbol.Size = 5; myUniqueValueRenderer.DefaultSymbol = myDefaultSimpleMarkerSymbol; // Group #1 // ======== // Create a UniqueValueInfo object as a container of information for each group. ESRI.ArcGIS.Client.UniqueValueInfo uniqueAvalueInfo1 = new ESRI.ArcGIS.Client.UniqueValueInfo(); // Define the value that contains the grouping of the Field defined as the UniqueValueRenderer.Field. uniqueAvalueInfo1.Value = "Alberto"; // Add an informational description and label for the group. uniqueAvalueInfo1.Description = "Small red circles"; uniqueAvalueInfo1.Label = "Hurricane Alberto"; // Each UniqueValueInfo grouping needs a symbol to display ESRI.ArcGIS.Client.Symbols.SimpleMarkerSymbol simpleMarkerSymbol1 = new ESRI.ArcGIS.Client.Symbols.SimpleMarkerSymbol(); System.Windows.Media.SolidColorBrush solidColorBrush1 = new System.Windows.Media.SolidColorBrush(Color.FromArgb(255, 255, 0, 0)); //Red simpleMarkerSymbol1.Color = solidColorBrush1; simpleMarkerSymbol1.Size = 5; uniqueAvalueInfo1.Symbol = simpleMarkerSymbol1; // Add the UniqueValueInfo information to the Infos (grouping) of the UniqueValueRenderer myUniqueValueRenderer.Infos.Add(uniqueAvalueInfo1); // Group #2 // ======== // Create a UniqueValueInfo object as a container of information for each group. ESRI.ArcGIS.Client.UniqueValueInfo uniqueAvalueInfo2 = new ESRI.ArcGIS.Client.UniqueValueInfo(); // Define the value that contains the grouping of the Field defined as the UniqueValueRenderer.Field. uniqueAvalueInfo2.Value = "Isaac"; // Add an informational description and label for the group. uniqueAvalueInfo2.Description = "Small green circles"; uniqueAvalueInfo2.Label = "Hurricane Isaac"; // Each UniqueValueInfo grouping needs a symbol to display ESRI.ArcGIS.Client.Symbols.SimpleMarkerSymbol simpleMarkerSymbol2 = new ESRI.ArcGIS.Client.Symbols.SimpleMarkerSymbol(); System.Windows.Media.SolidColorBrush solidColorBrush2 = new System.Windows.Media.SolidColorBrush(Color.FromArgb(255, 0, 255, 0)); //Green simpleMarkerSymbol2.Color = solidColorBrush2; simpleMarkerSymbol2.Size = 5; uniqueAvalueInfo2.Symbol = simpleMarkerSymbol2; // Add the UniqueValueInfo information to the Infos (grouping) of the UniqueValueRenderer myUniqueValueRenderer.Infos.Add(uniqueAvalueInfo2); // Group #3 // ======== // Create a UniqueValueInfo object as a container of information for each group. ESRI.ArcGIS.Client.UniqueValueInfo uniqueAvalueInfo3 = new ESRI.ArcGIS.Client.UniqueValueInfo(); // Define the value that contains the grouping of the Field defined as the UniqueValueRenderer.Field. uniqueAvalueInfo3.Value = "Michael"; // Add an informational description and label for the group. uniqueAvalueInfo3.Description = "Small blue circles"; uniqueAvalueInfo3.Label = "Hurricane Michael"; // Each UniqueValueInfo grouping needs a symbol to display ESRI.ArcGIS.Client.Symbols.SimpleMarkerSymbol simpleMarkerSymbol3 = new ESRI.ArcGIS.Client.Symbols.SimpleMarkerSymbol(); System.Windows.Media.SolidColorBrush solidColorBrush3 = new System.Windows.Media.SolidColorBrush(Color.FromArgb(255, 0, 0, 255)); //Blue simpleMarkerSymbol3.Color = solidColorBrush3; simpleMarkerSymbol3.Size = 5; uniqueAvalueInfo3.Symbol = simpleMarkerSymbol3; // Add the UniqueValueInfo information to the Infos (grouping) of the UniqueValueRenderer myUniqueValueRenderer.Infos.Add(uniqueAvalueInfo3); // Now that all of the UniqueValueInfo information has been added to the UniqueValueRenderer object, // associate the UniqueValueRenderer with the TemporalRenderer.ObservationRenderer Property. myTemporalRenderer.ObservationRenderer = myUniqueValueRenderer; // TrackRenderer Property: // ----------------------- // Setting the TrackIdField draws polylines in time order for a group of attributes. If the // TrackIdField property is not set and the TrackRenderer is used, then all point observations // will have a polyline connecting them in order of time. This becomes messy if multiple // events are occurring at the same time (i.e. hurricanes) and the linework would then look like // a spider diagram rather than discreet tracks with one per event. In this example to speed up // drawing time and limit the amount of data that is returned, the FeatureLayer.Where clause was // used to restrict only four hurricanes (or event) from displaying. If the FeatureLayer.Where // clause was commented out, more hurricanes would be displayed -- having the TrackIdField // becomes key to keeping each event separate. myTemporalRenderer.TrackIdField = "EVENTID"; // Define a SimpleRenderer with a SimpleLineSymbol to display each tracked event. The event // will be a yellow line connecting the time-based observations. ESRI.ArcGIS.Client.SimpleRenderer myTrackRenderer = new ESRI.ArcGIS.Client.SimpleRenderer(); ESRI.ArcGIS.Client.Symbols.SimpleLineSymbol defaultSimpleLineSymbol3 = new ESRI.ArcGIS.Client.Symbols.SimpleLineSymbol(); System.Windows.Media.SolidColorBrush defaultBrush3 = new System.Windows.Media.SolidColorBrush(Color.FromArgb(255, 255, 255, 255)); //White defaultSimpleLineSymbol3.Color = defaultBrush3; defaultSimpleLineSymbol3.Width = 1; myTrackRenderer.Symbol = defaultSimpleLineSymbol3; myTemporalRenderer.TrackRenderer = myTrackRenderer; // Apply the TemporalRenderer as the Renderer of the FeatureLayer. myFeatureLayer2.Renderer = myTemporalRenderer; // Add the myFeatureLayer2 to the myMap2 Layer Collection. Map2.Layers.Add(myFeatureLayer2); // Zoom to the middle of the Atlantic ocean. ESRI.ArcGIS.Client.Geometry.Envelope myEnvelope2 = new ESRI.ArcGIS.Client.Geometry.Envelope(); myEnvelope2.XMin = -77.69; myEnvelope2.YMin = -13.88; myEnvelope2.XMax = -11.77; myEnvelope2.YMax = 52.03; myMap2.Extent = myEnvelope2; } | |
| VB.NET | Copy Code |
|---|---|
Public Sub DrawHurricanesMultiple_TrackRenderer(ByVal myMap2 As ESRI.ArcGIS.Client.Map) ' Display the FeatureLayer in myMap2 that has a TemporalRenderer applied ' ====================================================================== ' Clear out any exiting layers myMap2.Layers.Clear() ' Add an ArcGISTiledMapsServiceLayer as a background to the map. Note: The first Layer added to the Map's ' Layers Collection is on the bottom and the other Layer is added on the top. Dim myArcGISTiledMapServiceLayer2 As New ESRI.ArcGIS.Client.ArcGISTiledMapServiceLayer myArcGISTiledMapServiceLayer2.Url = "http://services.arcgisonline.com/ArcGIS/rest/services/ESRI_StreetMap_World_2D/MapServer" myMap2.Layers.Add(myArcGISTiledMapServiceLayer2) ' Add a FeatureLayer to the map. Note: This Layer is drawn on top of the background layer. Dim myFeatureLayer2 As New ESRI.ArcGIS.Client.FeatureLayer ' This FeatureLayer contains hurricane data from NOAA. myFeatureLayer2.Url = "http://servicesbeta.esri.com/ArcGIS/rest/services/Hurricanes/Hurricanes/MapServer/0" ' The Where clause is optional. It is necessary when more that 500/1000 records returned. In ArcGIS Server ' 9.3.1 and prior, the default maximum is 500 records returned per FeatureLayer. In ArcGIS Server 10 the ' default is 1000. This setting is configurable per map service using ArcCatalog or ArcGIS Server Manager ' (on the Parameters tab). ' Only four hurricanes (Alberto, Isaac, Michael, and Nadine) are returned for this Where clause. myFeatureLayer2.Where = "EVENTID LIKE 'A' OR EVENTID LIKE 'a'" 'Get all hurricanes that contain the letter 'A' (upper or lower case). ' Specify the Outfields Property to specify which Fields are returned on which the ' TemporalRenderer.TrackIdField can use. Specifying the wildcard (*) character in the Add Property ' will return all Fields. myFeatureLayer2.OutFields.Add("*") ' Setting the Map's TimeExtent acts like a Where clause in that only those features/records that fall ' within the set TimeExtent will then be shown. If no Map.TimeExtent is set then only the ' ObservationRenderer is in effect. If a Map.TimeExtent is set then the ObservationRenderer and the ' TrackRenderer are in effect. In the case of this example the TimeExtent for the hurricane ' information is shortened to a small temporal window that just covers the time extent necessary to ' render the four hurricanes (Alberto, Isaac, Michael, and Nadine) that are returned by the service. Dim myTimeExtent As New ESRI.ArcGIS.Client.TimeExtent Dim date1 As Date = #8/1/2000 12:00:01 AM# 'Custom Start date/time myTimeExtent.Start = date1 Dim date2 As Date = #10/25/2000 12:00:01 AM# 'Custom End date/time myTimeExtent.End = date2 ' Manually setting the TimeExtent of the myMap2. Could have used a TimeSlider for more interactiveness. myMap2.TimeExtent = myTimeExtent ' Create the TemporalRenderer object. It will use two different Properties (ObservationRenderer, ' and TrackRenderer) to create the image. Dim myTemporalRenderer As New ESRI.ArcGIS.Client.TemporalRenderer ' When using a UniqueValueRenderer as the TemporalRenderer.ObservationRenderer Property, if you do not ' specify all of the UniqueValueInfo objects to cover all of the data observation possibilities (i.e. ' features returned) then those features for which there is no UniqueValueInfo will not be ' rendered (i.e. drawn) unless you set a Default symbol. ' ' Define a default SimpleMarkerSymbol for a 'catch all' to draw the features for which no UniqueValueInfo ' has been defined. In this example, there are four hurricanes that are returned as a result of the Where ' clause, they are: Alberto, Isaac, Michael, and Nadine. Yet only three UniqueValueInfo objects have been ' defined to render the hurricane movements, they are: Alberto, Isaac, and Michael. A UniqueValueInfo ' has been intentionally left our for hurricane Nadine. Defining a default SimpleMarkerSymbol will provide ' symbology for those features that are returned for Nadine. ' If a UniqueValueRenderer.DefaultSymbol was not defined, the features for Nadine would not be drawn on ' the Map. ' ' A UniqueValueRenderer should have 2 or more UniqueValueInfo Classes (meaning classification or ' grouping) to delineate the different symbology and class break information. The next three sections ' of code define 3 different UniqueValueInfo Classes (or groups) and their associated symbology. Dim myUniqueValueRenderer As New ESRI.ArcGIS.Client.UniqueValueRenderer myUniqueValueRenderer.Field = "EVENTID" 'Name of the hurricanes ' Define the Default symbol Dim myDefaultSimpleMarkerSymbol As New ESRI.ArcGIS.Client.Symbols.SimpleMarkerSymbol Dim mySolidColorBrush As New System.Windows.Media.SolidColorBrush(Color.FromArgb(255, 0, 0, 0)) 'Black myDefaultSimpleMarkerSymbol.Color = mySolidColorBrush myDefaultSimpleMarkerSymbol.Size = 5 myUniqueValueRenderer.DefaultSymbol = myDefaultSimpleMarkerSymbol ' Group #1 ' ======== ' Create a UniqueValueInfo object as a container of information for each group. Dim uniqueAvalueInfo1 As New ESRI.ArcGIS.Client.UniqueValueInfo ' Define the value that contains the grouping of the Field defined as the UniqueValueRenderer.Field. uniqueAvalueInfo1.Value = "Alberto" ' Add an informational description and label for the group. uniqueAvalueInfo1.Description = "Small red circles" uniqueAvalueInfo1.Label = "Hurricane Alberto" ' Each UniqueValueInfo grouping needs a symbol to display Dim simpleMarkerSymbol1 As New ESRI.ArcGIS.Client.Symbols.SimpleMarkerSymbol Dim solidColorBrush1 As New System.Windows.Media.SolidColorBrush(Color.FromArgb(255, 255, 0, 0)) 'Red simpleMarkerSymbol1.Color = solidColorBrush1 simpleMarkerSymbol1.Size = 5 uniqueAvalueInfo1.Symbol = simpleMarkerSymbol1 ' Add the UniqueValueInfo information to the Infos (grouping) of the UniqueValueRenderer myUniqueValueRenderer.Infos.Add(uniqueAvalueInfo1) ' Group #2 ' ======== ' Create a UniqueValueInfo object as a container of information for each group. Dim uniqueAvalueInfo2 As New ESRI.ArcGIS.Client.UniqueValueInfo ' Define the value that contains the grouping of the Field defined as the UniqueValueRenderer.Field. uniqueAvalueInfo2.Value = "Isaac" ' Add an informational description and label for the group. uniqueAvalueInfo2.Description = "Small green circles" uniqueAvalueInfo2.Label = "Hurricane Isaac" ' Each UniqueValueInfo grouping needs a symbol to display Dim simpleMarkerSymbol2 As New ESRI.ArcGIS.Client.Symbols.SimpleMarkerSymbol Dim solidColorBrush2 As New System.Windows.Media.SolidColorBrush(Color.FromArgb(255, 0, 255, 0)) 'Green simpleMarkerSymbol2.Color = solidColorBrush2 simpleMarkerSymbol2.Size = 5 uniqueAvalueInfo2.Symbol = simpleMarkerSymbol2 ' Add the UniqueValueInfo information to the Infos (grouping) of the UniqueValueRenderer myUniqueValueRenderer.Infos.Add(uniqueAvalueInfo2) ' Group #3 ' ======== ' Create a UniqueValueInfo object as a container of information for each group. Dim uniqueAvalueInfo3 As New ESRI.ArcGIS.Client.UniqueValueInfo ' Define the value that contains the grouping of the Field defined as the UniqueValueRenderer.Field. uniqueAvalueInfo3.Value = "Michael" ' Add an informational description and label for the group. uniqueAvalueInfo3.Description = "Small blue circles" uniqueAvalueInfo3.Label = "Hurricane Michael" ' Each UniqueValueInfo grouping needs a symbol to display Dim simpleMarkerSymbol3 As New ESRI.ArcGIS.Client.Symbols.SimpleMarkerSymbol Dim solidColorBrush3 As New System.Windows.Media.SolidColorBrush(Color.FromArgb(255, 0, 0, 255)) 'Blue simpleMarkerSymbol3.Color = solidColorBrush3 simpleMarkerSymbol3.Size = 5 uniqueAvalueInfo3.Symbol = simpleMarkerSymbol3 ' Add the UniqueValueInfo information to the Infos (grouping) of the UniqueValueRenderer myUniqueValueRenderer.Infos.Add(uniqueAvalueInfo3) ' Now that all of the UniqueValueInfo information has been added to the UniqueValueRenderer object, ' associate the UniqueValueRenderer with the TemporalRenderer.ObservationRenderer Property. myTemporalRenderer.ObservationRenderer = myUniqueValueRenderer ' TrackRenderer Property: ' ----------------------- ' Setting the TrackIdField draws polylines in time order for a group of attributes. If the ' TrackIdField property is not set and the TrackRenderer is used, then all point observations ' will have a polyline connecting them in order of time. This becomes messy if multiple ' events are occurring at the same time (i.e. hurricanes) and the linework would then look like ' a spider diagram rather than discreet tracks with one per event. In this example to speed up ' drawing time and limit the amount of data that is returned, the FeatureLayer.Where clause was ' used to restrict only four hurricanes (or event) from displaying. If the FeatureLayer.Where ' clause was commented out, more hurricanes would be displayed -- having the TrackIdField ' becomes key to keeping each event separate. myTemporalRenderer.TrackIdField = "EVENTID" ' Define a SimpleRenderer with a SimpleLineSymbol to display each tracked event. The event ' will be a yellow line connecting the time-based observations. Dim myTrackRenderer As New ESRI.ArcGIS.Client.SimpleRenderer Dim defaultSimpleLineSymbol3 As New ESRI.ArcGIS.Client.Symbols.SimpleLineSymbol Dim defaultBrush3 As New System.Windows.Media.SolidColorBrush(Color.FromArgb(255, 255, 255, 255)) 'White defaultSimpleLineSymbol3.Color = defaultBrush3 defaultSimpleLineSymbol3.Width = 1 myTrackRenderer.Symbol = defaultSimpleLineSymbol3 myTemporalRenderer.TrackRenderer = myTrackRenderer ' Apply the TemporalRenderer as the Renderer of the FeatureLayer. myFeatureLayer2.Renderer = myTemporalRenderer ' Add the myFeatureLayer2 to the myMap2 Layer Collection. Map2.Layers.Add(myFeatureLayer2) ' Zoom to the middle of the Atlantic ocean. Dim myEnvelope2 As New ESRI.ArcGIS.Client.Geometry.Envelope myEnvelope2.XMin = -77.69 myEnvelope2.YMin = -13.88 myEnvelope2.XMax = -11.77 myEnvelope2.YMax = 52.03 myMap2.Extent = myEnvelope2 End Sub | |
Remarks
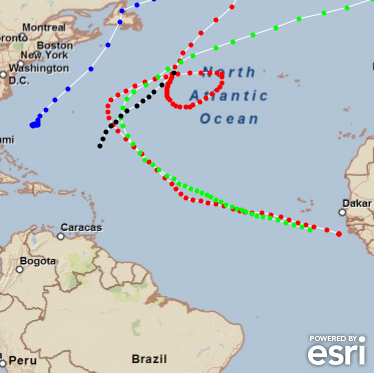
The TrackRenderer Property provides polyline based symbology that connects markers (i.e. Points) for time-based features per TrackIdField. If no TrackIdField has been specified then all observations that are returned from the Featurelayer will be symbolized in sequential order using the polyline graphic. The polyline graphic that is drawn begins with the first temporal observation and connects-the-dots as the phenomena moves spatially through time.
The following screen shot depicts an image of movement for four hurricanes in the Atlantic Ocean. Each hurricane has its own symbology as defined by the TemporalRenderer.ObservationRenderer. The solid red circles denote hurricane Alberto. The solid green circles denote hurricane Isaac. The solid blue circles denote hurricane Michael. The solid black circles denote hurricane Nadine. The hurricanes Alberto, Isaac, and Michael are renderer via UniqueValueInfo objects of a UniqueValueRenderer. The hurricane Nadine is rendered as the default symbology defined by the UniqueValueRenderer. The white polyline is defined as the path movement for each hurricane drawn by the TrackRenderer. The screen shot matches the code example provided in this documentation page.
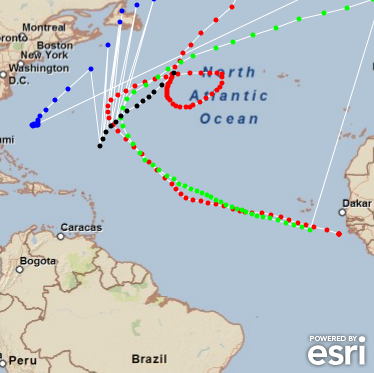
For the example code provided in this document had the TemporalRenderer.TrackIdField not been specified as part of creating a TrackRenderer, all point observations for the hurricanes would be connected into a single polyline based upon the time. This becomes messy if multiple events are occurring at the same time (i.e. hurricanes) and the linework would then look like a spider diagram rather than discreet tracks with one per event. See the following image for an example where the TemporalRenderer.TrackIdField was not specified while attempting to create a TrackRenderer.
Requirements
Target Platforms: Windows XP Professional, Windows Server 2003 family, Windows Vista, Windows Server 2008 family