
B U S I N E S S A N A L Y S T 10.1 R E S T R E P O R T T A S K
Measure Cannibalization Endpoint
Calculates the amount of overlap between two or more trade areas.
Availability: Business Analyst Server.
URL Example
http://localhost:6080/arcgis/rest/services/DefaultMap/MapServer/exts/BAServer/MeasureCannibalization/execute
Specific Parameters
Parameter |
Description |
|---|---|
AreaNameField (required) |
Area name field in the Boundaries layer. Type string. |
Boundaries (required) |
The polygon layer whose features represent trade areas. This layer is usually the Business Analyst trade area layer. Type DataLayer. |
AreaIDField (optional) |
Area ID field in the Boundaries layer. Type string. Default: AREA_ID. |
Other Parameters
Parameter |
Description |
|---|---|
OutputType (required) |
Array of task output options. Options for this endpoint include rendering an output image (GetMapImage), creating a feature layer for subsequent analysis (GetFeatureClass), and creating a report (GetReport). Type array of TaskOutputType. |
ActiveDatasetID (optional) |
ID of the active dataset. Type string. Default: ID of the first available dataset. |
f (optional) |
Response format. Type string. Available formats: HTML, JSON, PJSON, XML. Default: HTML. |
IsFullErrorMessage (optional) |
Mode for composing error messages. Type boolean. Default: false. |
OutputAnalysisItem (optional) |
Configuration options for storing the output feature layer in the repository. This will enable viewing and working with the output result in subsequent tasks. Type esriFolderItem. |
OutputReportItem (optional) |
Configuration options for storing the output report in the repository. This will enable viewing and working with the output result in subsequent tasks. Type esriFolderItem. |
OutputSpatialReference (optional) |
An option specifying the spatial reference to return the output feature layer. Type SpatialReference. If this parameter is missing, the output record set will be returned in the default spatial reference. See Get Default Spatial Reference lookup operation to query the default spatial reference. |
RenderingParameters (optional) |
Configuration options for rendering output when GetMapImage option is specified in the OutputType parameter. Type RenderingParameters. |
ReturnGeometry (optional) |
An option specifying the presence of the shape attribute in the returned record set. Type boolean. Default: true. |
StandardReportOptions (optional) |
Report parameters. Type ReportOptions. The TemplateName parameter is ignored. |
token |
Authentication token. This parameter is required if your Business Analyst Server is secured. Type string. |
Returns
Variable of type TaskResultOutput
Remarks
The Measure Cannibalization endpoint calculates the amount of overlap between trade areas of a trade area layer linked with different store locations. This overlap refers to the extent at which trade area boundaries coincide. The report will show the amount of overlap in the trade areas. For example, you could create drive-time trade area around an existing network of stores and a proposed new store location. The Measure Cannibalization endpoint will analyze the amount the new store will cannibalize the existing store network. It can be used to examine the amount of influence a new competitor will have in a given market.
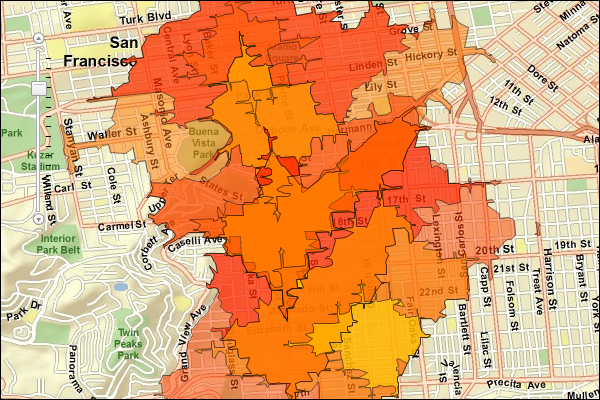
The illustration below is an example of the output for this method. The green shaded polygon represents the area the two yellow shaded polygons are cannibalizing each other.
The cannibalization of market areas is derived by comparing the sizes of the market areas as well as the extent of the overlap.
You can use the output polygon from the Measure Cannibalization endpoint to determine the demographic information for the area of overlap between trade areas.
Usage Tips
• The output feature layer will have the same spatial reference as the trade area layer.
• The trade area layer must be a polygon feature layer.
• The Measure Cannibalization endpoint is primarily used to examine the amount of overlap between two or more trade areas.
• In most cases, the trade area layers will be trade areas created with Business Analyst Server.
• Only overlapping trade areas are valid inputs for this function.
• The output feature layer is created from the actual area of overlap in the trade area features.
• If trade areas do not overlap, the output feature layer is not created.
Example Usage
The example below calculates cannibalized trade areas of a drive-time trade area layer and generates a report describing the cannibalized trade areas.
NOTE: The example uses the "Drive Time Polygons 1" polygon layer already created in the Trade Areas folder of the San Francisco Tutorial Project of the Default Workspace.
Response
{
  "results":
  [
    {
      "paramName":"OutputFeatureClass",
      "dataType":"GPFeatureRecordSetLayer",
      "value":
      {
        "geometryType":"esriGeometryPolygon",
        "spatialReference":
        {
          "wkid":4326
        },
        "fieldAliases":
        {
          "OBJECTID":"Object ID",
          "A1":"A1",
          "A2":"A2",
          "A3":"A3",
          "A4":"A4",
          "ID":"ID",
          "NAME":"NAME",
          "U":"U",
          "ID1":"ID1",
          "ID2":"ID2",
          "NAME1":"NAME1",
          "NAME2":"NAME2",
          "TA_DESC":"TA_DESC"
        },
        "fields":
        [
          {
            "name":"OBJECTID",
            "type":"esriFieldTypeOID",
            "alias":"Object ID"
          },
          ...
          {
            "name":"TA_DESC",
            "type":"esriFieldTypeString",
            "alias":"TA_DESC",
            "length":255
          }
        ],
        "features":
        [
          {
            "geometry":
            {
              "rings":
              [
                [
                  [
                    -122.424439016606,
                    37.7707834488356
                  ],
                  ...
                  [
                    -122.424439016606,
                    37.7707834488356
                  ]
                ],
                [
                  [
                    -122.412686758134,
                    37.7609387927017
                  ],
                  ...
                  [
                    -122.412686758134,
                    37.7609387927017
                  ]
                ]
              ],
              "spatialReference":
              {
                "wkid":4326
              }
            },
            "attributes":
            {
              "OBJECTID":1,
              "A1":1.41069751364719,
              "A2":0.32558763981875,
              "A3":0.419728329333425,
              "A4":0.592109710597951,
              "ID":"1_3 vs. 2_3",
              "NAME":"3 Minutes vs. 3 Minutes",
              "U":0,
              "ID1":"1_3",
              "ID2":"2_3",
              "NAME1":"3 Minutes",
              "NAME2":"3 Minutes",
              "TA_DESC":""
            }
          },
          ...
          {
            "geometry":
            {
              "rings":
              [
                [
                  [
                    -122.426318137484,
                    37.7650669673222
                  ],
                  ...
                  [
                    -122.426318137484,
                    37.7650669673222
                  ]
                ],
                ...
                [
                  [
                    -122.434711025412,
                    37.7591494483897
                  ],
                  ...
                  [
                    -122.434711025412,
                    37.7591494483897
                  ]
                ]
              ],
              "spatialReference":
              {
                "wkid":4326
              }
            },
            "attributes":
            {
              "OBJECTID":13,
              "A1":0.315723497090239,
              "A2":0.00499405208548983,
              "A3":0.0207084360961642,
              "A4":0.0065381398635507,
              "ID":"2_2 vs. 3_3",
              "NAME":"2 Minutes vs. 3 Minutes",
              "U":0,
              "ID1":"2_2",
              "ID2":"3_3",
              "NAME1":"2 Minutes",
              "NAME2":"3 Minutes",
              "TA_DESC":""
            }
          }
        ]
      }
    },
    {
      "paramName":"Measure Cannibalization.PDF",
      "dataType":"GPDataFile",
      "value":
      {
        "url":"http://localhost/arcgisoutput/_ags_TBB9810CB14E499A68EF790B98332F.pdf"
      }
    }
  ],
  "messages":
  [
  ]
}
NOTE: The response has been abbreviated where "..." is noted.
JSON Response Example Rendered with the ArcGIS API for JavaScript
See Also