
B U S I N E S S A N A L Y S T 10.5 R E S T T R A D E A R E A T A S K
Remove Overlap Endpoint
Removes overlap (cannibalization) between trade areas.
Availability: Business Analyst Server.
URL Example
http://localhost:6080/arcgis/rest/services/DefaultMap/MapServer/exts/BAServer/RemoveOverlap/execute
Specific Parameters
Parameter |
Description |
|---|---|
Boundaries (required) |
The polygon layer whose features represent trade areas. Type DataLayer. |
AreaLinkField (optional) |
The attribute field name in the input Boundaries layer which contains ID of an associated store. Type string. |
CenterMethod (optional) |
Area center selection method. Type esriOverlapRemoverCenterMethod. Default: esriOverlapRemoverCenterMethodUseCentroid. |
OverlapMethod (optional) |
Overlap removing method. Type esriOverlapRemoverOverlapMethod. Default: esriOverlapRemoverOverlapMethodThiessen. |
StoreIDField (optional) |
The attribute field name in the input Stores layer which is associated with unique store/business IDs (typically store numbers for retail establishments with multiple locations). Type string. Default: STORE_ID. |
Stores (optional) |
A point layer containing point features such as businesses, hospitals, schools, etc. which represent the locations from which the drive time trade/service areas will originate. Type PointLayer. |
WeightField (optional) |
The attribute field name in the input Boundaries layer which contains weights. Type string. |
WeightMethod (optional) |
Weight method used by the grid overlap removing method. Type esriOverlapRemoverWeightMethod. |
Other Parameters
Parameter |
Description |
|---|---|
OutputType (required) |
Array of task output options. Options for this endpoint include rendering an output image (GetMapImage), creating a feature layer for subsequent analysis (GetFeatureClass), and creating a report (GetReport). Type array of TaskOutputType. |
ActiveDatasetID (optional) |
ID of the active dataset. Type string. Default: ID of the first available dataset. |
DataHierarchy (optional) |
Name of a hierarchy of data layers used for generating summary reports. Type string. Use the Get Data Hierarchies lookup operation to query available geography hierarchies. Default: Standard Business Analyst Data. |
f (optional) |
Response format. Type string. Available formats: HTML, JSON, XML. Default: HTML. |
IsFullErrorMessage (optional) |
Mode for composing error messages. Type boolean. Default: false. |
OutputAnalysisItem (optional) |
Configuration options for storing the output feature layer in the repository. This will enable viewing and working with the output result in subsequent tasks. Type esriFolderItem. |
OutputReportItems (optional) |
Array of configuration options for storing the output reports in the repository. This will enable viewing and working with the output results in subsequent tasks. Type array of esriFolderItem. |
OutputSpatialReference (optional) |
An option specifying the spatial reference to return the output feature layer. Type SpatialReference. If this parameter is missing, the output record set will be returned in the default spatial reference. See Get Default Spatial Reference lookup operation to query the default spatial reference. |
RenderingParameters (optional) |
Configuration options for rendering output when GetMapImage option is specified in the OutputType parameter. Type RenderingParameters. |
ReportOptions (optional) |
Array specifying summary reports that will be generated using trade/service areas as boundary areas for analysis. Use the Get Report Templates lookup operation to query available report templates. Type array of ReportOptions. |
ReturnGeometry (optional) |
An option specifying the presence of the shape attribute in the returned record set. Type boolean. Default: true. |
token |
Authentication token. This parameter is required if your Business Analyst Server is secured. Type string. |
Returns
Variable of type TaskResultOutput. If the input Boundaries layer has no overlapping areas, an error is returned.
Remarks
The Remove Overlap endpoint removes cannibalization between trade areas generated in Business Analyst Server or custom derived trade areas. Overlap is removed using Thiessen polygons or the grid-based approach to find the midline between the intersecting areas.
The CenterMethod parameter specifies a way to identify center points of trade areas of the Boundaries layer—using area centroid (default) or using the location of store the trade area is associated with. In the last case, the following parameters should be specified:
• the AreaLinkField parameter specifies a field in the Boundaries layer containing ID of associated store (this is usually the STORE_ID field),
• the Stores parameter specifies the store layer, and
• the StoreIDField parameter specifies a field in the Stores layer containing store ID.
The OverlapMethod parameter specifies a method for area overlap removing—using Thiessen polygons (default) or using grid.
The WeightMethod parameter specifies a weight method used by the grid overlap removing method. Default method is "use area".
NOTE 1: Since Business Analyst Server 10.0, the SummaryDataLayerID parameter is replaced with an optional DataHierarchy parameter.
NOTE 2: Since Business Analyst Server 10.0, the OutputReportItem parameter is replaced with the OutputReportItems parameter which is an array of folder items. The number of items in this array should be equal to the number of items in the ReportOptions array.
NOTE 3: Since Business Analyst Server 10.0 SP1, the AreaIDField parameter is replaced with AreaLinkField.
How Does it Work
Assume you have two intersecting trade area polygons.

In the example below, the highlighted light blue area represents the overlap area. The two triangle symbols represent the stores for each trade area.

The RemoveOverlap method in Business Analyst Server is based on the assumption that the overlap is only removed by dividing the intersecting area. The method does not assign areas that are not overlapped to other stores. In the example above, only the area that is shaded blue will be affected by the RemoveOverlap method.
There are two approaches for removing overlap:
Method 1—Thiessen Polygon
The Thiessen polygon approach removes overlap between two or more trade areas using straight lines to divide the area of overlap. This approach uses a series of geometric functions to create nonoverlapping trade areas. First, a line is drawn between each store and a neighboring store.

Second, a perpendicular line is drawn bisecting the line drawn between the stores at a right angle. The dotted line below is drawn at the midpoint between the two store locations and represents the division between the two trade areas.

Method 2—Grid
The grid approach takes into account weights of the stores and the shape of the overlapping polygon to make the division more natural.
The grid approach uses a series of geometric functions to create nonoverlapping trade areas. First, a line is drawn between each store and a neighboring store. Second, two parallel lines are drawn that pass through the stores perpendicular to the line drawn between the stores. The red shaded area below illustrates the target area of intersection. This area is determined by finding the area of overlap between the two trade areas contained between the two perpendicular lines.

After determining the area of intersection, a grid is created by drawing parallel lines between the two stores. A simplified example is illustrated below.

Intersection points are then determined within the red area so each grid line can be divided into nonoverlapping trade areas. The yellow points above illustrate how the midpoints are determined. These points are connected to represent the division between the overlapping trade areas.

In the grid approach, there are three different methods for determining where to draw the intersection line. These three methods determine how the midpoints are set to draw a line between the two polygons to remove the overlap. Specifically, these three methods determine where the yellow dots are placed.
Use weight field
The weight method uses a numeric weight field you specify to determine the location of the midpoints. For example, you could use the ratio of the size of each store (gross leasable area or square footage) to determine where to draw the area of overlap. If the green store is larger than the red store, the yellow dots will move to the right and the resulting green trade area will be larger.
Use area of trade area as weights
If you do not have numeric attribute data to determine the weights, you can use the area of the trade areas to determine the location of the midpoints. This method assumes that larger trade areas will have more influence in a particular market. For example, the green store's trade area is larger, and the yellow dots will move to the right.
Use the actual midpoint of the intersecting grid line
In this method, the midpoints are placed so the grid lines are divided equally in the red shaded area. The geometric midpoint is determined by measuring the length of each parallel grid line and dividing each line equally between the stores.
Usage Tips
• The spatial reference of the output feature layer will be the same as the trade area layer.
• The trade area layer must be a polygon feature layer.
• In most cases, the trade area layer will be a trade area created in Business Analyst Server.
• The Thiessen polygon method will remove overlap using straight lines.
• The grid approach will remove overlap with a line that reflects the shape and curve of the input polygon feature layer.
Example Usage
The example below generates non-overlapping trade areas derived from two overlapping trade areas.
Response
{
  "results":
  [
    {
      "paramName":"OutputFeatureClass",
      "dataType":"GPFeatureRecordSetLayer",
      "value":
      {
        "geometryType":"esriGeometryPolygon",
        "spatialReference":
        {
          "wkid":4326
        },
        "fieldAliases":
        {
          "OBJECTID":"Object ID",
          "AREA_ID":"AREA_ID",
          "RING":"RING",
          "STORE_ID":"STORE_ID"
        },
        "fields":
        [
          {
            "name":"OBJECTID",
            "type":"esriFieldTypeOID",
            "alias":"Object ID"
          },
          ...
          {
            "name":"STORE_ID",
            "type":"esriFieldTypeString",
            "alias":"STORE_ID",
            "length":256
          }
        ],
        "features":
        [
          {
            "geometry":
            {
              "rings":
              [
                [
                  [
                    -117.233003,
                    32.747165
                  ],
                  ...
                  [
                    -117.233003,
                    32.747165
                  ]
                ]
              ],
              "spatialReference":
              {
                "wkid":4326
              }
            },
            "attributes":
            {
              "OBJECTID":1,
              "AREA_ID":"1_1",
              "RING":1,
              "STORE_ID":"1"
            }
          },
          {
            "geometry":
            {
              "rings":
              [
                [
                  [
                    -117.14076,
                    32.863424
                  ],
                  ...
                  [
                    -117.14076,
                    32.863424
                  ]
                ]
              ],
              "spatialReference":
              {
                "wkid":4326
              }
            },
            "attributes":
            {
              "OBJECTID":2,
              "AREA_ID":"2_1",
              "RING":1,
              "STORE_ID":"2"
            }
          }
        ]
      }
    }
  ],
  "messages":
  [
  ]
}
NOTE: The response has been abbreviated where "..." is noted.
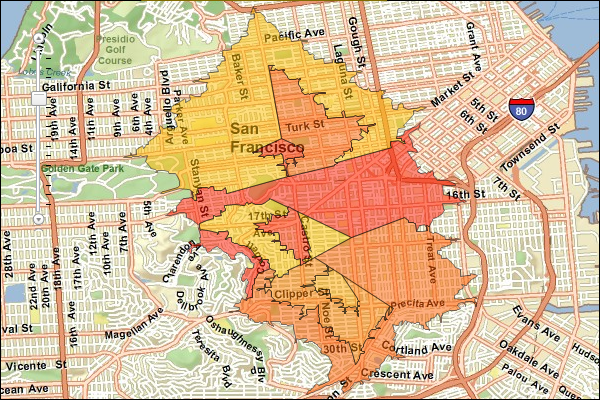
JSON Response Example Rendered with the ArcGIS API for JavaScript
See Also