
B U S I N E S S A N A L Y S T 10.5 R E S T T R A D E A R E A T A S K
Grids Endpoint
Generates an equidistant vector-based grid network for a specified area.
Availability: Business Analyst Server.
URL Example
http://localhost:6080/arcgis/rest/services/DefaultMap/MapServer/exts/BAServer/Grids/execute
Specific Parameters
Parameter |
Description |
|---|---|
AnalysisExtent (required) |
Analysis extent. Type ExtentData. |
DistanceUnits (required) |
The distance units for the GridCellSize property. Type esriUnits. |
GridCellSize (required) |
Size of grid cells. Type double. |
AggregationHierarchy (optional) |
Name of a hierarchy of data layers used to calculate summarization fields. Type string. Use the Get Data Hierarchies lookup operation to query available geography hierarchies. Default: Standard Business Analyst Data. |
Summarizations (optional) |
Summarization fields to be appended to the output feature layer. Type array of string. |
SymbolizationField (optional) |
Name of summarization field to do symbolization by. Type string. |
Other Parameters
Parameter |
Description |
|---|---|
OutputType (required) |
Array of task output options. Options for this endpoint include rendering an output image (GetMapImage), creating a feature layer for subsequent analysis (GetFeatureClass), and creating a report (GetReport). Type array of TaskOutputType. |
ActiveDatasetID (optional) |
ID of the active dataset. Type string. Default: ID of the first available dataset. |
DataHierarchy (optional) |
Name of a hierarchy of data layers used for generating summary reports. Type string. Use the Get Data Hierarchies lookup operation to query available geography hierarchies. Default: Standard Business Analyst Data. |
f (optional) |
Response format. Type string. Available formats: HTML, JSON, XML. Default: HTML. |
IsFullErrorMessage (optional) |
Mode for composing error messages. Type boolean. Default: false. |
OutputAnalysisItem (optional) |
Configuration options for storing the output feature layer in the repository. This will enable viewing and working with the output result in subsequent tasks. Type esriFolderItem. |
OutputReportItems (optional) |
Array of configuration options for storing the output reports in the repository. This will enable viewing and working with the output results in subsequent tasks. Type array of esriFolderItem. |
OutputSpatialReference (optional) |
An option specifying the spatial reference to return the output feature layer in. Type SpatialReference. If this parameter is missing, the output record set will be returned in the default spatial reference. See Get Default Spatial Reference lookup operation to query the default spatial reference. |
RenderingParameters (optional) |
Configuration options for rendering output when GetMapImage option is specified in the OutputType parameter. Type RenderingParameters. |
ReportOptions (optional) |
Array specifying summary reports that will be generated using trade/service areas as boundary areas for analysis. Use the Get Report Templates lookup operation to query available report templates. Type array of ReportOptions. |
ReturnGeometry (optional) |
An option specifying the presence of the shape attribute in the returned record set. Type boolean. Default: true. |
token |
Authentication token. This parameter is required if your Business Analyst Server is secured. Type string. |
Returns
Variable of type TaskResultOutput
Remarks
Grids are created by collecting a geographic extent (envelope) and a grid size in a predefined unit of measurement. The Grids method is used to create a vector based graticule layer for a given area. You can aggregate demographic information (or other Business Analyst data) for each grid cell. For example, you can aggregate based on the total population or average household income for each cell.
The AnalysisExtent parameter specifies the market area to create a vector based graticule layer in. The grid size is specified by the GridCellSize and DistanceUnits parameters.
Optional summarization fields specified in the Summarizations array and in the SymbolizationField parameter are calculated for every grid cell using the hierarchy of data layers specified with the AggregationHierarchy parameter and are appended to the output feature layer. The output map is thematically shaded if the SymbolizationField parameter is specified.
NOTE 1: Since Business Analyst Server 10.0, the GridDataLayerID and SummaryDataLayerID parameters are replaced with optional AggregationHierarchy and DataHierarchy parameters, respectively.
NOTE 2: Since Business Analyst Server 10.0, the OutputReportItem parameter is replaced with the OutputReportItems parameter which is an array of folder items. The number of items in this array should be equal to the number of items in the ReportOptions array.
How Does it Work
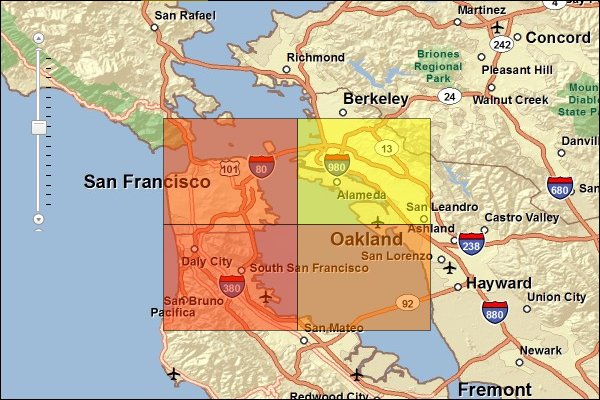
The purpose of the Grids method is to examine and compare variables in different cells. Often referred to as "hot spot analysis", grid cells are of equal size and area and show comparisons in different areas.
The image below has the total households for each grid cell thematically shaded. By utilizing grid cells, the household values are normalized for comparison purposes.
Usage Tips
• This method creates vector based grid cells for a specified size and extent.
• Valid numeric distances must be used when defining grid cell size values. Negative distances cannot be used.
• The output grid will be created at the specified cell size.
• It is recommended that you limit your grid size to 1 mile or larger to reflect data accuracy and appropriate retrieval of demographic data that is apportioned to the grids.
• Creating very small grid cells for a large extent will increase the process time when aggregating data from another layer. Each grid cell is the equivalent of a trade area.
Example Usage
The example below creates a user-defined grid to summarize selected demographic variables and generates a summary report.
Response
{
  "results":
  [
    {
      "paramName":"OutputFeatureClass",
      "dataType":"GPFeatureRecordSetLayer",
      "value":
      {
        "geometryType":"esriGeometryPolygon",
        "spatialReference":
        {
          "wkid":4326
        },
        "fieldAliases":
        {
          "FID":"FID",
          "AREA_ID":"AREA_ID",
          "ROW_ID":"ROW_ID",
          "COLUMN_ID":"COLUMN_ID",
          "A_COLUMNID":"A_COLUMNID",
          "A_AREA_ID":"A_AREA_ID",
          "TOTHH_CY":"TOTHH_CY",
          "TOTPOP_CY":"TOTPOP_CY",
          "TA_DESC":"TA_DESC"
        },
        "fields":
        [
          {
            "name":"FID",
            "type":"esriFieldTypeOID",
            "alias":"FID"
          },
          ...
          {
            "name":"TA_DESC",
            "type":"esriFieldTypeString",
            "alias":"TA_DESC",
            "length":254
          }
        ],
        "features":
        [
          {
            "geometry":
            {
              "rings":
              [
                [
                  [
                    -122.33201,
                    37.718404
                  ],
                  ...
                  [
                    -122.33201,
                    37.718404
                  ]
                ]
              ],
              "spatialReference":
              {
                "wkid":4326
              }
            },
            "attributes":
            {
              "FID":0,
              "AREA_ID":0,
              "ROW_ID":0,
              "COLUMN_ID":0,
              "A_COLUMNID":"A",
              "A_AREA_ID":"A0",
              "TOTHH_CY":321068,
              "TOTPOP_CY":749917,
              "TA_DESC":"Grids(10 Miles): Cell(0,0)"
            }
          },
          ...
          {
            "geometry":
            {
              "rings":
              [
                [
                  [
                    -122.14912,
                    37.573404
                  ],
                  ...
                  [
                    -122.14912,
                    37.573404
                  ]
                ]
              ],
              "spatialReference":
              {
                "wkid":4326
              }
            },
            "attributes":
            {
              "FID":3,
              "AREA_ID":3,
              "ROW_ID":1,
              "COLUMN_ID":1,
              "A_COLUMNID":"B",
              "A_AREA_ID":"B1",
              "TOTHH_CY":12668,
              "TOTPOP_CY":36587,
              "TA_DESC":"Grids(10 Miles): Cell(1,1)"
            }
          }
        ]
      }
    },
    {
      "paramName":"Age by Income Profile.PDF",
      "dataType":"GPDataFile",
      "value":
      {
        "url":"http://localhost/arcgisoutput/_ags_TD8C6DF9B3443F9C43322E6156A734.pdf"
      }
    }
  ],
  "messages":
  [
  ]
}
NOTE: The response has been abbreviated where "..." is noted.
JSON Response Example Rendered with the ArcGIS API for JavaScript
See Also