
B U S I N E S S A N A L Y S T 10.5 R E S T A N A L Y S I S T A S K
Find Similar Endpoint
Scores potential sites or trade areas against an existing well-performing master site.
Availability: Business Analyst Server.
URL Example
http://localhost:6080/arcgis/rest/services/DefaultMap/MapServer/exts/BAServer/FindSimilar/execute
Specific Parameters
Parameter |
Description |
|---|---|
AnalysisType (required) |
Analysis type. Type esriFindSimilarAnalysisType. |
Boundaries (required) |
Target polygon layer whose sites are ranked on similarity with the master site. Type DataLayer. |
MasterSiteOID (required) |
OID of the master site. Type int. |
AnalysisExtent (optional) |
Analysis extent. Type ExtentData. |
CommonFields (optional) |
Fields of the Boundaries layer used for ranking sites. Type array of string. |
DataHierarchy (optional) |
Name of a hierarchy of data layers to get demography for analysis. Type string. Use the Get Data Hierarchies lookup operation to query available geography hierarchies. Default: Standard Business Analyst Data. |
MasterSiteLayer (optional) |
Polygon layer to get the master site. Type DataLayer. |
PCAEigenValue (optional) |
Eigenvalue boundary for Principal Component Analysis. Type double. |
PCARankSites (optional) |
Maximal number of sites to rank with Principal Component Analysis. Type int. |
PercentValues (optional) |
Array of tolerance values in percents for Conventional Analysis. Type string. |
Summarizations (optional) |
Demography variables used for ranking sites. Type array of string. |
Other Parameters
Parameter |
Description |
|---|---|
OutputType (required) |
Array of task output options. Options for this endpoint include rendering an output image (GetMapImage) and/or creating a feature layer for subsequent analysis (GetFeatureClass). Type array of TaskOutputType. |
ActiveDatasetID (optional) |
ID of the active dataset. Type string. Default: ID of the first available dataset. |
f (optional) |
Response format. Type string. Available formats: HTML, JSON, XML. Default: HTML. |
IsFullErrorMessage (optional) |
Mode for composing error messages. Type boolean. Default: false. |
OutputAnalysisItem (optional) |
Configuration options for storing the output feature layer in the repository. This will enable viewing and working with the output result in subsequent tasks. Type esriFolderItem. |
OutputSpatialReference (optional) |
An option specifying the spatial reference to return the output feature layer in. Type SpatialReference. If this parameter is missing, the output record set will be returned in the default spatial reference. See Get Default Spatial Reference lookup operation to query the default spatial reference. |
RenderingParameters (optional) |
Configuration options for rendering output when GetMapImage option is specified in the OutputType parameter. Type RenderingParameters. |
ReturnGeometry (optional) |
An option specifying the presence of the shape attribute in the returned record set. Type boolean. Default: true. |
token |
Authentication token. This parameter is required if your Business Analyst Server is secured. Type string. |
Returns
Variable of type TaskResultOutput
Remarks
The Find Similar endpoint is used to score potential new sites against a known, well-performing site, called a master site.
The analysis can be restricted to an analysis extent if the AnalysisExtent parameter is specified.
The boundary layer sites are ranked similarity with a master site. If the MasterSiteLayer parameter is specified, the master site is selected from the master site layer. Otherwise, the master site is selected from the boundary layer. In both cases, the master site is selected by the OID value specified in the MasterSiteOID parameter.
The variables to rank sites by are collected from two sources: the CommonFields parameter specifies fields of the boundary layer and the Summarizations parameter specifies demographic variables.
Two types of analysis are supported—the Conventional Analysis and the Principal Component Analysis.
For the Conventional Analysis, the PercentValues array specifies the tolerance values in percents for ranking variables: at the beginning of the boundary layer fields and after the demography variables. The Conventional Analysis is limited to five variables.
For the Principal Component Analysis, the PCARankSites parameter can specify the maximum number of sites with the best rank to be written to the output layer. If it is absent, all sites are ranked. The PCAEigenValue parameter specifies the eigenvalue boundary for Kaiser Criterion used in the Principal Component Analysis. The default value is 1 as recommended.
NOTE: Since Business Analyst Server 10.0, the DataLayerID parameter is replaced with an optional DataHierarchy parameter.
How Does it Work
Why do some stores do better than others? The old real estate axiom of "location, location, location" is usually the most important part of the answer. The Find Similar algorithm is based on the idea that the characteristics of a master site can be used to find similar sites elsewhere. The FindSimilar endpoint allows you to score polygon data—for example, simple rings, drive times, and other forms of trade areas.
The master site can be based on your best location or a typical location. You can select a master site based on a trade area around a store with a particular product mix or on one that has the highest rate of same store sales. You have to pick the master site candidate against which FindSimilar will score. You can choose your master site from the data layer to be scored or from another polygon layer.
Although it isn't required, you should compare similar-sized areas around the master and scored sites. For example, if you're using a 5-minute drive time around your master site, you should create and use a 5-minute drive time around the other features in the target layer.
The are two approaches for running the FindSimilar endpoint—the Conventional Analysis and the Principal Component Analysis.
Conventional Analysis
The Conventional Analysis compares the master site against the other features in the target layer based on variables you select. This method has a fundamental assumption that you know what variables are important in ranking sites based on similarity. That you can precisely identify the relevant variables is an assumption that might not hold in most cases. For instance, if block groups were used as the level of geography, deciding on the right variables is not easy, sometimes setting the range to +/- 60 percent for the chosen variables does not find a similar site.
The Conventional Analysis ranks trade areas by comparing values, of up to five variables, of the master site to the scored sites. You will assign a +/- percentage that you would like the sites to be scored according to the master site value. Sites are then assigned a score of 1-5 based on the number of variables that match the criteria you set.
Principal Component Analysis (PCA)
The PCA removes the burden of variable selection while still providing a ranking of the sites according to the level of similarity. You can choose as many variables as you want.
The figure below illustrates how the variables or neighbors can be selected where K is the number of neighbors to be found.
The PCA considers a set of variables for each site as a vector. It then considers a set of vectors for all potential sites and the master site and performs the PCA on it in the following sequence:
1. Build correlation matrix.
2. Find eigenvectors and values for correlation matrix.
3. Drop eigenvectors with eigenvalues less than 1 using Kaiser Criterion.
4. These eigenvectors form a subspace in the initial space.
5. Projections to this subspace are calculated for all vectors.
6. The projected data are standardized to zero mean and unit standard deviation.
7. K closest similar potential sites are chosen using Euclidean distance.
The resulting layer contains K potential sites closest to the master site.
Usage Tips
• The master site can be chosen from one of the features in the target layer or in another master layer.
• When using the Conventional Analysis, set your ranges (expressed as percentages) for each variable at 25 percent for your initial analysis. This will give you a better chance to score your potential sites at a ranking of more than zero.
• The Conventional Analysis is limited to a maximum of five variables.
• If you are unsure of the variables needed to properly score your master and potential sites, run the FindSimilar method using the PCA. This approach allows you to enter as many variables as desired and lets Business Analyst determine the best variables to score the sites.
• It is recommended that the eigenvalue of 1 be left as the default based on the widely accepted Kaiser criterion.
• Choosing the number of features to rank with the PCA, you can limit the number of features displayed in the output. All the features are analyzed with this approach, but only the top K features will be displayed.
Example Usage
The example below generates a list of areas of interest based on selected demographic and marketing characteristics using the Conventional Analysis.
Response
{
 "results": [
  {
   "paramName": "RecordSet",
   "dataType": "GPFeatureRecordSetLayer",
   "value": {
    "displayFieldName": "",
    "fieldAliases": {
     "OBJECTID": "Object ID",
     "HHPOP_CY": "HHPOP_CY",
     "TOTPOP_CY": "TOTPOP_CY",
     "RANK": "Rank Field",
     "OID_": "OID_",
     "AREA_ID": "AREA_ID",
     "STORE_ID": "STORE_ID",
     "RING": "RING",
     "RING_DEFN": "RING_DEFN",
     "AREA_DESC": "AREA_DESC"
    },
    "geometryType": "esriGeometryPolygon",
    "spatialReference": {
     "wkid": 4326,
     "latestWkid": 4326
    },
    "fields": [
     {
      "name": "OBJECTID",
      "type": "esriFieldTypeOID",
      "alias": "Object ID"
     },
     {
      "name": "HHPOP_CY",
      "type": "esriFieldTypeDouble",
      "alias": "HHPOP_CY"
     },
     {
      "name": "TOTPOP_CY",
      "type": "esriFieldTypeDouble",
      "alias": "TOTPOP_CY"
     },
     {
      "name": "RANK",
      "type": "esriFieldTypeInteger",
      "alias": "Rank Field"
     },
     {
      "name": "OID_",
      "type": "esriFieldTypeInteger",
      "alias": "OID_"
     },
     {
      "name": "AREA_ID",
      "type": "esriFieldTypeString",
      "alias": "AREA_ID",
      "length": 256
     },
     {
      "name": "STORE_ID",
      "type": "esriFieldTypeString",
      "alias": "STORE_ID",
      "length": 256
     },
     {
      "name": "RING",
      "type": "esriFieldTypeInteger",
      "alias": "RING"
     },
     {
      "name": "RING_DEFN",
      "type": "esriFieldTypeString",
      "alias": "RING_DEFN",
      "length": 256
     },
     {
      "name": "AREA_DESC",
      "type": "esriFieldTypeString",
      "alias": "AREA_DESC",
      "length": 256
     }
    ],
    "features": [
     {
      "attributes": {
       "OBJECTID": 1,
       "HHPOP_CY": 825301.34949899989,
       "TOTPOP_CY": 849052.19248900015,
       "RANK": 1,
       "OID_": 2,
       "AREA_ID": "2_1",
       "STORE_ID": "2",
       "RING": 1,
       "RING_DEFN": "5",
       "AREA_DESC": "0 - 5 Miles"
      },
      "geometry": {
       "rings": [
        [
         [
          -122.34610914286401,
          37.710814697494598
         ],
         [
          -122.404717633044,
          37.664296122518394
         ],
         [
          -122.48651348554,
          37.674585016191301
         ],
         [
          -122.524184911958,
          37.733214655796402
         ],
         [
          -122.486598312884,
          37.791890171551003
         ],
         [
          -122.43289999999999,
          37.805748265065105
         ],
         [
          -122.35900658433999,
          37.775840365753993
         ],
         [
          -122.34610914286401,
          37.710814697494598
         ]
        ]
       ]
      }
     }
    ]
   }
  }
 ],
 "messages": [

 ]
}
The example below generates a list of areas of interest based on selected demographic and marketing characteristics using the Principal Component Analysis.
Response
{
  "results":
  [
    {
      "paramName":"OutputFeatureClass",
      "dataType":"GPFeatureRecordSetLayer",
      "value":
      {
        "geometryType":"esriGeometryPolygon",
        "spatialReference":
        {
          "wkid":4326
        },
        "fieldAliases":
        {
          "OBJECTID":"Object ID",
          "AVGHHSZ_CY":"AVGHHSZ_CY",
          "AVGHINC_CY":"AVGHINC_CY",
          "EDBACH_CY":"EDBACH_CY",
          "EMP_FY":"EMP_FY",
          "MARRIED_CY":"MARRIED_CY",
          "OWNER_CY":"OWNER_CY",
          "PCI_CY":"PCI_CY",
          "POPU5_CY":"POPU5_CY",
          "TOTHH_CY":"TOTHH_CY",
          "TOTPOP_CY":"TOTPOP_CY",
          "RANK":"Rank Field",
          "AREA_ID":"AREA_ID",
          "STORE_ID":"STORE_ID",
          "RING":"RING",
          "RING_DEFN":"RING_DEFN",
          "AREA_DESC":"AREA_DESC",
          "Shape_area":"Shape.area",
          "Shape_len":"Shape.len"
        },
        "fields":
        [
          {
            "name":"OBJECTID",
            "type":"esriFieldTypeOID",
            "alias":"Object ID"
          },
          ...
          {
            "name":"Shape_len",
            "type":"esriFieldTypeDouble",
            "alias":"Shape.len"
          }
        ],
        "features":
        [
          {
            "geometry":
            {
              "rings":
              [
                [
                  [
                    -122.439951522452,
                    37.7861335252587
                  ],
                  ...
                  [
                    -122.439951522452,
                    37.7861335252587
                  ]
                ]
              ],
              "spatialReference":
              {
                "wkid":4326
              }
            },
            "attributes":
            {
              "OBJECTID":1,
              "AVGHHSZ_CY":2.0471593351483,
              "AVGHINC_CY":109606.513964283,
              "EDBACH_CY":36284.139399,
              "EMP_FY":73086.684569,
              "MARRIED_CY":25354.24528,
              "OWNER_CY":13907.732848,
              "PCI_CY":52636,
              "POPU5_CY":3896.753897,
              "TOTHH_CY":55832.117555,
              "TOTPOP_CY":117295.687194,
              "RANK":1,
              "AREA_ID":"1_3",
              "STORE_ID":1,
              "RING":3,
              "RING_DEFN":"0 - 3 Minutes",
              "AREA_DESC":"3 Minutes",
              "Shape_area":0,
              "Shape_len":0
            }
          },
          ...
          {
            "geometry":
            {
              "rings":
              [
                [
                  [
                    -122.424439016606,
                    37.7707834488356
                  ],
                  ...
                  [
                    -122.424439016606,
                    37.7707834488356
                  ]
                ]
              ],
              "spatialReference":
              {
                "wkid":4326
              }
            },
            "attributes":
            {
              "OBJECTID":3,
              "AVGHHSZ_CY":2.41519546828562,
              "AVGHINC_CY":106390.153477346,
              "EDBACH_CY":24731.177243,
              "EMP_FY":55698.525867,
              "MARRIED_CY":25804.027671,
              "OWNER_CY":11594.906553,
              "PCI_CY":43527,
              "POPU5_CY":4534.112516,
              "TOTHH_CY":39366.708933,
              "TOTPOP_CY":96748.524141,
              "RANK":3,
              "AREA_ID":"2_3",
              "STORE_ID":2,
              "RING":3,
              "RING_DEFN":"0 - 3 Minutes",
              "AREA_DESC":"3 Minutes",
              "Shape_area":0,
              "Shape_len":0
            }
          }
        ]
      }
    }
  ],
  "messages":
  [
  ]
}
NOTE: The response has been abbreviated where "..." is noted.
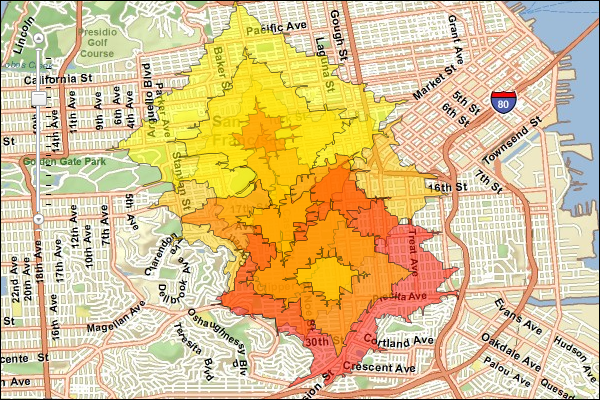
JSON Response Example Rendered with the ArcGIS API for JavaScript
See Also