
B U S I N E S S A N A L Y S T 10.5 R E S T T R A D E A R E A T A S K
Customer Derived Areas Endpoint
Creates trade areas around store features based on percentages of their customers measured in straight-line distance from stores.
Availability: Business Analyst Server.
URL Example
http://localhost:6080/arcgis/rest/services/DefaultMap/MapServer/exts/BAServer/CustomerDerivedAreas/execute
Specific Parameters
Parameter |
Description |
|---|---|
CustomerLinkField (required) |
The attribute field in the input Customers layer which links every customer with associated store/business ID. Type string. |
Customers (required) |
A point layer containing point features which represent the locations of customers. Type PointLayer. |
Percentages (required) |
Array of percentages of customers, in ascending size. Type array of double. |
Stores (required) |
A point layer containing point features such as businesses, hospitals, schools, etc. Type PointLayer. |
AnalysisExtent (optional) |
Data extent to restrict the analysis. Type ExtentData. |
CustomerWeightField (optional) |
The Customers layer field to calculate weighted percentage. Type string. |
CutOffDistance (optional) |
Cut off threshold distance in the units specified in the CutOffDistance property. Type double. |
CutOffUnits (optional) |
The distance units of the CutOffDistance property which is used to calculate the cut off distance. Type esriUnits. Default: esriMiles. |
Donut (optional) |
An option specifying creation of donut-style trade/service areas instead of areas that all originate from the store/business point origins. Type boolean. Default: false. |
HullType (optional) |
An option specifying the type of hull to be created around store points. Type esriHullType. Default: Simple. |
SingleStoreID (optional) |
ID of a single store to generate trade area for. Type string. |
StoreIDField (optional) |
The attribute field name in the input Stores layer which is associated with unique store/business IDs (typically store numbers for retail establishments with multiple locations). Type string. Default: STORE_ID. |
UseCustomersCentroid (optional) |
An option specifying the use of the centroid of customers associated with a store instead of the store location point. Type boolean. Default: false. |
Other Parameters
Parameter |
Description |
|---|---|
OutputType (required) |
Array of task output options. Options for this endpoint include rendering an output image (GetMapImage), creating a feature layer for subsequent analysis (GetFeatureClass), and creating a report (GetReport). Type array of TaskOutputType. |
ActiveDatasetID (optional) |
ID of the active dataset. Type string. Default: ID of the first available dataset. |
DataHierarchy (optional) |
Name of a hierarchy of data layers used for generating summary reports. Type string. Use the Get Data Hierarchies lookup operation to query available geography hierarchies. Default: Standard Business Analyst Data. |
f (optional) |
Response format. Type string. Available formats: HTML, JSON, XML. Default: HTML. |
IsFullErrorMessage (optional) |
Mode for composing error messages. Type boolean. Default: false. |
OutputAnalysisItem (optional) |
Configuration options for storing the output feature layer in the repository. This will enable viewing and working with the output result in subsequent tasks. Type esriFolderItem. |
OutputReportItems (optional) |
Array of configuration options for storing the output reports in the repository. This will enable viewing and working with the output results in subsequent tasks. Type array of esriFolderItem. |
OutputSpatialReference (optional) |
An option specifying the spatial reference to return the output feature layer. Type SpatialReference. If this parameter is missing, the output record set will be returned in the default spatial reference. See Get Default Spatial Reference lookup operation to query the default spatial reference. |
RenderingParameters (optional) |
Configuration options for rendering output when GetMapImage option is specified in the OutputType parameter. Type RenderingParameters. |
ReportOptions (optional) |
Array specifying summary reports that will be generated using trade/service areas as boundary areas for analysis. Use the Get Report Templates lookup operation to query available report templates. Type array of ReportOptions. |
ReturnGeometry (optional) |
An option specifying the presence of the shape attribute in the returned record set. Type boolean. Default: true. |
token |
Authentication token. This parameter is required if your Business Analyst Server is secured. Type string. |
Returns
Variable of type TaskResultOutput
Remarks
This endpoint calculates the size and shape of the market area based on your customer points or a numeric field contained within your customer file, such as sales. This endpoint accurately represents each store's actual area of influence, and the detail and extent of the trade area is based on the type of analysis you select.
The analysis can be restricted to an analysis extent if the AnalysisExtent parameter is specified. Optional SingleStoreID parameter restricts the analysis to a single store of the store layer.
Tuning parameters
• The HullType parameter specifies a type of hull to be created around every store location.
• If the CustomerWeightField parameter is specified, the percentages of customers are calculated using values of this field as the weight.
• If the CutOffDistance parameter is specified, the customers outside of this distance from associated stores are excluded from the analysis. The CutOffUnits parameter should be specified in this case.
• If the UseCustomersCentroid parameter is true, the customers’ centroids are used instead of stores as centers of trade areas.
• If the Donut parameter is true, the donut trade areas are created.
NOTE 1: Since Business Analyst Server 10.0, the SummaryDataLayerID parameter is replaced with an optional DataHierarchy parameter.
NOTE 2: Since Business Analyst Server 10.0, the OutputReportItem parameter is replaced with the OutputReportItems parameter which is an array of folder items. The number of items in this array should be equal to the number of items in the ReportOptions array.
How Does it Work
Business Analyst Server allows you to create 1, 2, or 3 market areas around your store, called primary, secondary, and tertiary markets, respectively. More than three are not often used but are possible with Business Analyst Server.
These market areas can be determined by:
• Number of customers—For example, create a trade area around each store that includes the closest 60 percent of customers.
• Weighted value—For example, create a trade area around each store that includes the closest 60 percent of customer sales, number of purchases, and so forth.
How the outline is created
Business Analyst Server creates a boundary around the outermost set of customer points that meet the specified criteria. This is the most accurate method of defining a market area.
There are four types of analyses available when creating customer derived trade areas.
• Simple trade areas—Generalized, convex trade areas. In this case, a simple hull is created around the customer points.
• Amoeba trade areas—Trade areas that take into account all your customer points and join extreme points using elliptical arcs.

• Detailed trade areas—Trade areas that take into account all your customer points and join extreme points using straight lines.

• Detailed with Smoothing trade areas—Detailed trade areas that take into account all your customer points and join extreme points with a smoothed curve using cubic splines. This approach takes into account the shape and pattern of the customer distributions.

Usage Tips
• The spatial reference of the output feature layer will be the same as the store layer.
• The store layer and customer layer must both be point features.
• The customer layer should have at least three customer points.
• Valid numeric values must be used when defining customer derived trade area values. Negative values cannot be used.
• Donut rings create output polygons that are bands.
• Simple trade areas are generalized, convex trade areas.
• Amoeba trade areas are more detailed trade areas that take into account all your customer points and join extreme points using elliptical arcs.
• Detailed trade areas are much more complex trade areas that take into account all your customer points and join extreme points using straight lines.
• Detailed with smoothing trade areas are detailed trade areas that take into account all your customer points and join extreme points with a smoothed curve using cubic splines. This approach takes into account the shape and pattern of your customer distribution.
• Using the centroid of the store's customers as a center for a trade area can be helpful when the store is located outside the customer area and you want to see customer trade areas that show customer concentration around their center point.
Example Usage
The example below generates a study/trade area consisting of regions derived from the spatial distribution of customer locations in a customer layer.
Response
{
  "results":
  [
    {
      "paramName":"OutputFeatureClass",
      "dataType":"GPFeatureRecordSetLayer",
      "value":
      {
        "geometryType":"esriGeometryPolygon",
        "spatialReference":
        {
          "wkid":4326
        },
        "fieldAliases":
        {
          "FID":"FID",
          "AREA_ID":"AREA_ID",
          "STORE_ID":"STORE_ID",
          "RING":"RING",
          "RING_DEFN":"RING_DEFN",
          "AREA_DESC":"AREA_DESC",
          "AREA_DESC2":"AREA_DESC2",
          "AREA_DESC3":"AREA_DESC3",
          "STORE_LAT":"STORE_LAT",
          "STORE_LONG":"STORE_LONG",
          "Count":"Count",
          "Weight":"Weight",
          "Latitude":"Latitude",
          "Longitude":"Longitude",
          "NAME":"NAME",
          "DESCR":"DESCR",
          "STORE_ADDR":"STORE_ADDR"
        },
        "fields":
        [
          {
            "name":"FID",
            "type":"esriFieldTypeOID",
            "alias":"FID"
          },
          ...
          {
            "name":"STORE_ADDR",
            "type":"esriFieldTypeString",
            "alias":"STORE_ADDR",
            "length":254
          }
        ],
        "features":
        [
          {
            "geometry":
            {
              "rings":
              [
                [
                  [
                    -117.204,
                    32.769
                  ],
                  ...
                  [
                    -117.204,
                    32.769
                  ]
                ]
              ],
              "spatialReference":
              {
                "wkid":4326
              }
            },
            "attributes":
            {
              "FID":0,
              "AREA_ID":"1_3",
              "STORE_ID":"1",
              "RING":3,
              "RING_DEFN":"",
              "AREA_DESC":"0 - 100",
              "AREA_DESC2":"CustomerDerivedAreas: 100 radius",
              "AREA_DESC3":"",
              "STORE_LAT":32.869087,
              "STORE_LONG":-117.246866,
              "Count":7,
              "Weight":7,
              "Latitude":32.869087,
              "Longitude":-117.246866,
              "NAME":"lj_store",
              "DESCR":"La Jolla Store",
              "STORE_ADDR":"3252 Holiday Court"
            }
          },
          ...
          {
            "geometry":
            {
              "rings":
              [
                [
                  [
                    -117.2151,
                    32.85116
                  ],
                  ...
                  [
                    -117.2151,
                    32.85116
                  ]
                ]
              ],
              "spatialReference":
              {
                "wkid":4326
              }
            },
            "attributes":
            {
              "FID":2,
              "AREA_ID":"1_1",
              "STORE_ID":"1",
              "RING":1,
              "RING_DEFN":"",
              "AREA_DESC":"0 - 50",
              "AREA_DESC2":"CustomerDerivedAreas: 50 radius",
              "AREA_DESC3":"",
              "STORE_LAT":32.869087,
              "STORE_LONG":-117.246866,
              "Count":4,
              "Weight":4,
              "Latitude":32.869087,
              "Longitude":-117.246866,
              "NAME":"lj_store",
              "DESCR":"La Jolla Store",
              "STORE_ADDR":"3252 Holiday Court"
            }
          }
        ]
      }
    },
    {
      "paramName":"Demographic and Income Report.PDF",
      "dataType":"GPDataFile",
      "value":
      {
        "url":"http://localhost/arcgisoutput/_ags_T5217623F64ECCA8265B233EC8BD81.pdf"
      }
    }
  ],
  "messages":
  [
  ]
}
NOTE: The response has been abbreviated where "..." is noted.
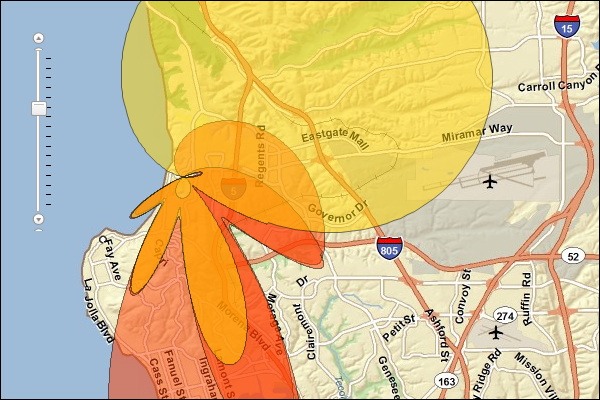
JSON Response Example Rendered with the ArcGIS API for JavaScript
See Also