


 Syntax
Parameters
- value
Example
How to use:
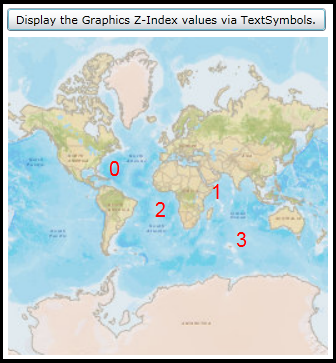
Click the button to draw some Graphics in the Map. The Graphics will have Z-Index values assigned. Each Graphic will be rendered using a TextSymbol that displays its Z-Index value.
The XAML code in this example is used in conjunction with the code-behind (C# or VB.NET) to demonstrate the functionality.
The following screen shot corresponds to the code example in this page.
| XAML |  Copy Code Copy Code |
|---|---|
<Grid x:Name="LayoutRoot"> <!-- Add a Map control with an ArcGISTiledMapServiceLayer. --> <esri:Map Background="White" HorizontalAlignment="Left" Margin="12,111,0,0" Name="Map1" VerticalAlignment="Top" Height="318" Width="483" > <esri:ArcGISTiledMapServiceLayer ID="PhysicalTiledLayer" Url="http://services.arcgisonline.com/ArcGIS/rest/services/World_Street_Map/MapServer"/> </esri:Map> <!-- Provide the instructions on how to use the sample code. --> <TextBlock Height="64" HorizontalAlignment="Left" Name="TextBlock1" VerticalAlignment="Top" Width="512" TextWrapping="Wrap" Margin="12,12,0,0" Text="Click the button to draw some Graphics in the Map. The Graphics will have Z-Index values assigned. Each Graphic will be rendered using a TextSymbol that displays its Z-Index value." /> <!-- Add a Button to perform the work. Note: the Click Event handler is wired-up to use code-behind. --> <Button Content="Display the Graphics Z-Index values via TextSymbols." Height="23" HorizontalAlignment="Left" Margin="93,82,0,0" Name="Button1" VerticalAlignment="Top" Width="319" Click="Button1_Click"/> </Grid> | |
| C# | Copy Code |
|---|---|
private void Button1_Click(object sender, System.Windows.RoutedEventArgs e) { // This is the main function will add a new GraphicsLayer to the Map. The GraphicsLayer will contain // Graphics based upon MapPoint geometries. As part of the example code, the Graphics will be assigned // Z-Index values. The Z-Index values will be displayed as TextSymbols for ease of viewing. // Create a new instance of the GraphicsLayer object ESRI.ArcGIS.Client.GraphicsLayer myGraphicsLayer = new ESRI.ArcGIS.Client.GraphicsLayer(); // Add a few graphics to the GraphicsLayer myGraphicsLayer.Graphics.Add(MakeGraphic(-7356594.25, 4752385.95, 102100)); myGraphicsLayer.Graphics.Add(MakeGraphic(5468910.57, 1875915.58, 102100)); myGraphicsLayer.Graphics.Add(MakeGraphic(-1558708.66, -326382.05, 102100)); myGraphicsLayer.Graphics.Add(MakeGraphic(8614958.43, -4191639.11, 102100)); // Assign some Z-Index values to the Graphics. AssignZIndexValues(myGraphicsLayer); // Assign a TextSymbol to the Graphics that use the Z-Index values. AssignTextSymbol(myGraphicsLayer); // Add the GraphicsLayer to the Layers collection of the Map (this will automatically cause a refresh // of the Map). Map1.Layers.Add(myGraphicsLayer); } public object MakeGraphic(double X, double Y, int SR) { // This function constructs a new Graphic. Note: the symbology has not been defined at this point. // Create a SpatialReference for the Graphic. ESRI.ArcGIS.Client.Geometry.SpatialReference aSpatialReference = new ESRI.ArcGIS.Client.Geometry.SpatialReference(SR); // Create a MapPoint object and set its SpatialReference and coordinate (X,Y) information. ESRI.ArcGIS.Client.Geometry.MapPoint aMapPoint = new ESRI.ArcGIS.Client.Geometry.MapPoint(X, Y, aSpatialReference); // Create a new instance of one Graphic and assigen its Geometry. ESRI.ArcGIS.Client.Graphic aGraphic = new ESRI.ArcGIS.Client.Graphic(); aGraphic.Geometry = (ESRI.ArcGIS.Client.Geometry.Geometry)aMapPoint; // Return the created Graphic. return aGraphic; } public void AssignZIndexValues(ESRI.ArcGIS.Client.GraphicsLayer theGraphicsLayer) { // This function set the Z Index value in the same order as the Graphics in the GraphicsLayer. // Get the GraphicCollection from the GraphicsLayer. ESRI.ArcGIS.Client.GraphicCollection theGraphicCollection = theGraphicsLayer.Graphics; // Create a counter. int myindex = 0; // Loop through each Graphic in the GraphicCollection foreach (ESRI.ArcGIS.Client.Graphic aGraphic in theGraphicCollection) { // Set the Z Index value by the counter. aGraphic.SetZIndex(myindex); // Incriment the counter. myindex = myindex + 1; } } public void AssignTextSymbol(ESRI.ArcGIS.Client.GraphicsLayer theGraphicsLayer) { // This function assigns a TextSymbol to the Graphics in the GraphicsLayer. The TextSymbol.Text // Property uses the existing Graphics Z-Index value. // Get the GraphicCollection from the GraphicsLayer. ESRI.ArcGIS.Client.GraphicCollection theGraphicCollection = theGraphicsLayer.Graphics; // Loop through each Graphic in the GraphicCollection foreach (ESRI.ArcGIS.Client.Graphic aGraphic in theGraphicCollection) { // Create a new TextSymbol and define its look. The strings used to define the FontFamily can be // found in the following MSDN documentation: // http://msdn.microsoft.com/en-us/library/cc189010(v=VS.95).aspx ESRI.ArcGIS.Client.Symbols.TextSymbol aTextSymbol = new ESRI.ArcGIS.Client.Symbols.TextSymbol(); aTextSymbol.FontFamily = new FontFamily("Arial"); aTextSymbol.FontSize = 20; aTextSymbol.Foreground = new System.Windows.Media.SolidColorBrush(Colors.Red); // Set the TextSymbol.Text Property to the Z-Index value that was assigend previosuly. aTextSymbol.Text = aGraphic.GetZIndex; // Assign the TextSymbol as the Graphic.Symbol as this was not previously done. aGraphic.Symbol = (ESRI.ArcGIS.Client.Symbols.Symbol)aTextSymbol; } } | |
| VB.NET | Copy Code |
|---|---|
Private Sub Button1_Click(ByVal sender As System.Object, ByVal e As System.Windows.RoutedEventArgs) ' This is the main function will add a new GraphicsLayer to the Map. The GraphicsLayer will contain ' Graphics based upon MapPoint geometries. As part of the example code, the Graphics will be assigned ' Z-Index values. The Z-Index values will be displayed as TextSymbols for ease of viewing. ' Create a new instance of the GraphicsLayer object Dim myGraphicsLayer As New ESRI.ArcGIS.Client.GraphicsLayer ' Add a few graphics to the GraphicsLayer myGraphicsLayer.Graphics.Add(MakeGraphic(-7356594.25, 4752385.95, 102100)) myGraphicsLayer.Graphics.Add(MakeGraphic(5468910.57, 1875915.58, 102100)) myGraphicsLayer.Graphics.Add(MakeGraphic(-1558708.66, -326382.05, 102100)) myGraphicsLayer.Graphics.Add(MakeGraphic(8614958.43, -4191639.11, 102100)) ' Assign some Z-Index values to the Graphics. AssignZIndexValues(myGraphicsLayer) ' Assign a TextSymbol to the Graphics that use the Z-Index values. AssignTextSymbol(myGraphicsLayer) ' Add the GraphicsLayer to the Layers collection of the Map (this will automatically cause a refresh of the Map). Map1.Layers.Add(myGraphicsLayer) End Sub Public Function MakeGraphic(ByVal X As Double, ByVal Y As Double, ByVal SR As Integer) ' This function constructs a new Graphic. Note: the symbology has not been defined at this point. ' Create a SpatialReference for the Graphic. Dim aSpatialReference As New ESRI.ArcGIS.Client.Geometry.SpatialReference(SR) ' Create a MapPoint object and set its SpatialReference and coordinate (X,Y) information. Dim aMapPoint As New ESRI.ArcGIS.Client.Geometry.MapPoint(X, Y, aSpatialReference) ' Create a new instance of one Graphic and assigen its Geometry. Dim aGraphic As New ESRI.ArcGIS.Client.Graphic aGraphic.Geometry = CType(aMapPoint, ESRI.ArcGIS.Client.Geometry.Geometry) ' Return the created Graphic. Return aGraphic End Function Public Sub AssignZIndexValues(ByVal theGraphicsLayer As ESRI.ArcGIS.Client.GraphicsLayer) ' This function set the Z Index value in the same order as the Graphics in the GraphicsLayer. ' Get the GraphicCollection from the GraphicsLayer. Dim theGraphicCollection As ESRI.ArcGIS.Client.GraphicCollection = theGraphicsLayer.Graphics ' Create a counter. Dim myindex As Integer = 0 ' Loop through each Graphic in the GraphicCollection For Each aGraphic As ESRI.ArcGIS.Client.Graphic In theGraphicCollection ' Set the Z Index value by the counter. aGraphic.SetZIndex(myindex) ' Incriment the counter. myindex = myindex + 1 Next End Sub Public Sub AssignTextSymbol(ByVal theGraphicsLayer As ESRI.ArcGIS.Client.GraphicsLayer) ' This function assigns a TextSymbol to the Graphics in the GraphicsLayer. The TextSymbol.Text ' Property uses the existing Graphics Z-Index value. ' Get the GraphicCollection from the GraphicsLayer. Dim theGraphicCollection As ESRI.ArcGIS.Client.GraphicCollection = theGraphicsLayer.Graphics ' Loop through each Graphic in the GraphicCollection For Each aGraphic As ESRI.ArcGIS.Client.Graphic In theGraphicCollection ' Create a new TextSymbol and define its look. The strings used to define the FontFamily can be ' found in the following MSDN documentation: ' http://msdn.microsoft.com/en-us/library/cc189010(v=VS.95).aspx Dim aTextSymbol As New ESRI.ArcGIS.Client.Symbols.TextSymbol aTextSymbol.FontFamily = New FontFamily("Arial") aTextSymbol.FontSize = 20 aTextSymbol.Foreground = New System.Windows.Media.SolidColorBrush(Colors.Red) ' Set the TextSymbol.Text Property to the Z-Index value that was assigend previosuly. aTextSymbol.Text = aGraphic.GetZIndex ' Assign the TextSymbol as the Graphic.Symbol as this was not previously done. aGraphic.Symbol = CType(aTextSymbol, ESRI.ArcGIS.Client.Symbols.Symbol) Next End Sub | |
Remarks
A Z-Index is an internal property of a Graphic in a GraphicCollection that defines the stack order of the Graphic. A Graphic with a higher Z-Index value always draws on top of another Graphic with a lower Z-Index value.
By default all Graphic objects in a GraphicCollecton have a Z-Index value of zero (0) unless specifically set in either code-behind or XAML.
If no Z-Index value has ever been set, Graphics are drawn on the Map in the order that they are created in code-behind or XAML. This means the first Graphic in the GraphicCollection is drawn first and the process repeats itself until the last Graphic in the GraphicCollection is draw.
Do not confuse the Z-Index with another common GIS term: Z-Value. A Z-Value in an elevation or terrain model means elevation. In other kinds of surface models a Z-Value could represent density or quantify of a particular attribute.
Requirements
Target Platforms: Windows XP Professional, Windows Server 2003 family, Windows Vista, Windows Server 2008 family