


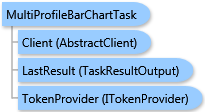
 Object Model
Syntax
Remarks
Segmentation Charts graphically display values for each Tapestry segment when comparing two or more profiles. These charts are used to illustrate the values in a Customer Tapestry Profile Report.
The Multi-profile Bar Chart task compares up to three target profiles to a single base profile. The first target profile in the list of segmentation profiles will be used to create the bar chart. The other two target profiles will be displayed as trend lines on top of the bar chart.
The result of this task is a ESRI.ArcGIS.Client.BACore.TaskResultOutput object, which is compatible with ArcGIS Server's mapping APIs. The output report is specified as a single item of the array of ESRI.ArcGIS.Client.BACore.ReportInfo objects. Additionally, the output report can be stored to the Business Analyst Server repository.
Inheritance Hierarchy
System.Object
ESRI.ArcGIS.Client.BACore.Client.AbstractTask
ESRI.ArcGIS.Client.BACore.Client.BATask<TResult,TEventArgs>
ESRI.ArcGIS.Client.BAServer.Tasks.BAServerTask<TResult>
ESRI.ArcGIS.Client.BAServer.Tasks.Segmentation.MultiProfileBarChartTask
Requirements
Target Platforms: Windows 98, Windows NT 4.0, Windows Millennium Edition, Windows 2000, Windows XP Home Edition, Windows XP Professional, Windows Server 2003 family, Windows Vista, Windows Server 2008 family