


 Syntax
| Visual Basic (Declaration) | |
|---|---|
Public Property TimeExtent As TimeExtent | |
| C# | |
|---|---|
public TimeExtent TimeExtent {get; set;} | |
Example
How to use:
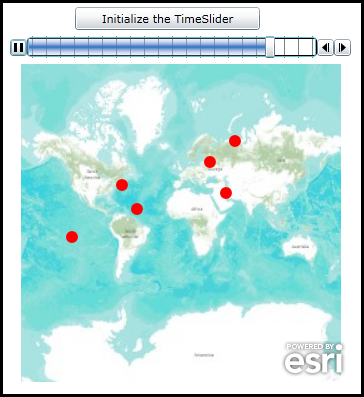
Click the button to initialize the TimeSlider functions (play, pause, forward, back) to display Graphics with TimeExtent Properties set.
The XAML code in this example is used in conjunction with the code-behind (C# or VB.NET) to demonstrate the functionality.
The following screen shot corresponds to the code example in this page.
| XAML |  Copy Code Copy Code |
|---|---|
<Grid x:Name="LayoutRoot"> <!-- Define two SimpleMarkerSymbol's and a SpatialReference in the Resources section of the XAML file. --> <Grid.Resources> <!-- Tip: Use x:Key Attribute and not x:Name Attribute for defining the name of the Resources so that you can access the Resource in the code-behind file. --> <!-- The 'RedMarkerSymbol' will be used as the default symbol for the Graphics. --> <esri:SimpleMarkerSymbol x:Key="RedMarkerSymbol" Color="Red" Size="12" Style="Circle" /> <!-- Define a SpatialReference object that has the same WKID as the ArcGISTiledMapServiceLayer in the Map. This will allow for the Graphics in the GraphicsLayer to line up properly. --> <esri:SpatialReference x:Key="theSpatialReference" WKID="102100"/> </Grid.Resources> <!-- Add a Map control with an ArcGISTiledMapServiceLayer and a GraphicsLayer. The Map.TimeExtent is bound to the MyTimeSlider (TimeSlider) control. The MyTimeSlider will control what TimeExtent (i.e. slices of time) can be viewed in the Map control. The GraphicsLayer will contain several Graphics based upon MapPoint geometries (which use the defined SpatialReference) which use the RedMarkerSymbol as the default symbolization, and have various TimeExtent values set. When the specific Graphic elements have a TimeExtent that falls within the Map.TimeExtent will they be displayed based upon the MyTimeSlider settings. --> <esri:Map Background="White" HorizontalAlignment="Left" Margin="12,108,0,0" Name="Map1" VerticalAlignment="Top" Height="318" Width="341" TimeExtent="{Binding ElementName=MyTimeSlider, Path=Value}"> <esri:ArcGISTiledMapServiceLayer ID="PhysicalTiledLayer" Url="http://services.arcgisonline.com/ArcGIS/rest/services/World_Topo_Map/MapServer" /> <!-- It is important to provide the GraphicsLayer with an 'ID' Attribute so to be able to access it in the code-behind file. --> <esri:GraphicsLayer ID="MyGraphicsLayer" > <esri:GraphicsLayer.Graphics> <!-- Each Graphic added to the GraphicsLayer will have it's symbology, time extent and geometry defined. --> <esri:Graphic Symbol="{StaticResource RedMarkerSymbol}" TimeExtent="2000/08/04 12:00:01 UTC" > <esri:MapPoint X="-7356594.25" Y="4752385.95" SpatialReference="{StaticResource theSpatialReference}"/> </esri:Graphic> <esri:Graphic Symbol="{StaticResource RedMarkerSymbol}" TimeExtent="2000/08/07 06:30:00 UTC"> <esri:MapPoint X="5654893.89" Y="3718746.02" SpatialReference="{StaticResource theSpatialReference}"/> </esri:Graphic> <esri:Graphic Symbol="{StaticResource RedMarkerSymbol}" TimeExtent="2000/08/10 05:15:15 UTC"> <esri:MapPoint X="-13654893.89" Y="-1718746.02" SpatialReference="{StaticResource theSpatialReference}"/> </esri:Graphic> <esri:Graphic Symbol="{StaticResource RedMarkerSymbol}" TimeExtent="2000/08/14 03:03:00 UTC"> <esri:MapPoint X="3654893.89" Y="7718746.02" SpatialReference="{StaticResource theSpatialReference}"/> </esri:Graphic> <esri:Graphic Symbol="{StaticResource RedMarkerSymbol}" TimeExtent="2000/08/18 09:11:51 UTC"> <esri:MapPoint X="6801033.36" Y="10325547.30" SpatialReference="{StaticResource theSpatialReference}"/> </esri:Graphic> <esri:Graphic Symbol="{StaticResource RedMarkerSymbol}" TimeExtent="2000/08/20 01:00:03 UTC"> <esri:MapPoint X="-5468910.57" Y="1741081.03" SpatialReference="{StaticResource theSpatialReference}"/> </esri:Graphic> <esri:Graphic Symbol="{StaticResource RedMarkerSymbol}" TimeExtent="2000/08/22 18:23:43 UTC"> <esri:MapPoint X="-4614958.43" Y="-326382.05" SpatialReference="{StaticResource theSpatialReference}"/> </esri:Graphic> </esri:GraphicsLayer.Graphics> </esri:GraphicsLayer> </esri:Map> <!-- Add a TimeSlider to control the display of what geographic features are displayed in the Map Control based upon a specified TimeExtent. In the case of this sample code, when the specific Graphic elements have a TimeExtent that falls within the Map.TimeExtent will they be displayed based upon the MyTimeSlider settings. Tip: It is the x:Name Attribute that allows you to access the TimeSlider Control in the code-behind file. The Loop Attribute of True allows continuous playing of the TimeSlider once it intialized in the code-behind. The PlaySpeed Attribute follows the format of "hh:mm:ss" where, hh = hours (0 to 24), mm = minutes (0 to 60), and ss = seconds (0 to 60). In this example the PlaySpeed increments the time intervals every tenth of a second (i.e. 0.1). The TimeMode Attribute of CumulativeFromStart means there is a fixed start date/time (2000/08/04 00:00:00 UTC in this example) that does not change and an end date/time that adjusts as the specified Interval (one day in this example which is set in the code-behind) increases. As the 'thumb' of the TimeSlider control moves to the right along the slider track the TimeExtent Interval of the TimeSlider increases. The MinimumValue Attribute specifies the starting date/time of the TimeSlider track. The MaximumValue Attribute specifies the ending date/time of the TimeSlider track. The Value Attribute specifies the date/time location of the thumb along the TimeSlider track. The thumb can have a start date/time and end date/time set for a TimeExtent which will display a window of time as the thumb moves along the TimeSlider track but this is best for TimeMode Attribute of 'TimeExtent'. Since this example is showing a TimeMode of 'CumulativeFromStart' it is best to have the thumb just use a single date/time specified for the Value set to the same date/time as the MinimumValue. The last thing needed to enable the full capabilities of a TimeSlider (i.e. having the play, pause, forward, and back buttons) is to set the Intervals Property. In Silverlight, this can only be done in code-behind to construct the Collection Type of IEnumerable(Of Date). Without the TimeSlider.Intervals being set the user has to manually move the thumb across the TimeSlider track to change the Map.TimeExtent and thereby see what Graphics can be displayed for that date/time window. --> <esri:TimeSlider x:Name="MyTimeSlider" Loop="True" PlaySpeed="0:0:0.1" TimeMode="CumulativeFromStart" MinimumValue="2000/08/04 00:00:00 UTC" MaximumValue="2000/08/24 00:00:00 UTC" Height="22" Margin="12,80,0,0" Value="2000/08/04 00:00:00 UTC" HorizontalAlignment="Left" VerticalAlignment="Top" Width="341" /> <!-- Provide the instructions on how to use the sample code. --> <TextBlock Height="40" HorizontalAlignment="Left" Name="TextBlock1" VerticalAlignment="Top" Width="455" TextWrapping="Wrap" Margin="12,12,0,0" Text="Click the button to initialize the TimeSlider functions (play, pause, forward, back) to display Graphics with TimeExtent Properties set." /> <!-- Add a button to perform the work. --> <Button Content="Initialize the TimeSlider" Height="23" HorizontalAlignment="Left" Margin="77,51,0,0" Name="Button1" VerticalAlignment="Top" Width="185" Click="Button1_Click"/> </Grid> | |
| C# | Copy Code |
|---|---|
private void Button1_Click(object sender, System.Windows.RoutedEventArgs e) { // This function sets up TimeSlider Intervals that define the tic marks along the TimeSlider track. Intervals // are a Collection of IEnumerable(Of Date) objects. When the TimeSlider.Intervals Property is set along with // the other necessary TimeSlider Properties, the full functionality of the TimeSlider is enabled. This full // functionality includes buttons for Play, Pause, Forward, and Back. // Obtain the start and end Date/Time values from the TimeSlider named MyTimeSlider that was defined in XAML. DateTime myMinimumDate = MyTimeSlider.MinimumValue; DateTime myMaximumDate = MyTimeSlider.MaximumValue; // Create a TimeExtent based upon the start and end date/times. ESRI.ArcGIS.Client.TimeExtent myTimeExtent = new ESRI.ArcGIS.Client.TimeExtent(myMinimumDate, myMaximumDate); // Create a new TimeSpan (1 day in our case). TimeSpan myTimeSpan = new TimeSpan(1, 0, 0, 0); // Create an empty Collection of IEnumerable(Of Date) objects. System.Collections.Generic.IEnumerable<DateTime> myIEnumerableDates = null; // Load all of Dates into the Collection of IEnumerable(Of Date) objects using the // TimeSlider.CreateTimeStopsByTimeInterval Shared/Static function. myIEnumerableDates = ESRI.ArcGIS.Client.Toolkit.TimeSlider.CreateTimeStopsByTimeInterval(myTimeExtent, myTimeSpan); // Set the TimeSlider.Intervals which define the tic marks along the TimSlider track to the IEnumerable(Of Date) // objects. MyTimeSlider.Intervals = myIEnumerableDates; } | |
| VB.NET | Copy Code |
|---|---|
Private Sub Button1_Click(ByVal sender As System.Object, ByVal e As System.Windows.RoutedEventArgs) ' This function sets up TimeSlider Intervals that define the tic marks along the TimeSlider track. Intervals ' are a Collection of IEnumerable(Of Date) objects. When the TimeSlider.Intervals Property is set along with ' the other necessary TimeSlider Properties, the full functionality of the TimeSlider is enabled. This full ' functionality includes buttons for Play, Pause, Forward, and Back. ' Obtain the start and end Date/Time values from the TimeSlider named MyTimeSlider that was defined in XAML. Dim myMinimumDate As Date = MyTimeSlider.MinimumValue Dim myMaximumDate As Date = MyTimeSlider.MaximumValue ' Create a TimeExtent based upon the start and end date/times. Dim myTimeExtent As New ESRI.ArcGIS.Client.TimeExtent(myMinimumDate, myMaximumDate) ' Create a new TimeSpan (1 day in our case). Dim myTimeSpan As New TimeSpan(1, 0, 0, 0) ' Create an empty Collection of IEnumerable(Of Date) objects. Dim myIEnumerableDates As System.Collections.Generic.IEnumerable(Of Date) ' Load all of Dates into the Collection of IEnumerable(Of Date) objects using the ' TimeSlider.CreateTimeStopsByTimeInterval Shared/Static function. myIEnumerableDates = ESRI.ArcGIS.Client.Toolkit.TimeSlider.CreateTimeStopsByTimeInterval(myTimeExtent, myTimeSpan) ' Set the TimeSlider.Intervals which define the tic marks along the TimSlider track to the IEnumerable(Of Date) ' objects. MyTimeSlider.Intervals = myIEnumerableDates End Sub | |
Remarks
A TimeExtent defines the temporal period for which a phenomenon is relevant. A TimeExtent can be relevant for a singular specific instance of time (example: Tuesday February 1, 2011 at 11:30 am) or a window of time (example: Tuesday February 1st 2011 at 11:30 am to Wednesday February 2nd 2011 at 1:30 pm). The Graphic.TimeExtent Property is based on a TimeExtent Object and can be constructed via a number of methods/formats using the System.DateTime Object.
When a Graphic has a TimeExtent and the Map Control has a TimeExtent set, the Graphic will not be rendered if it does not intersect the Map's TimeExtent. By adjusting the Map.TimeExtent users can see visually how a Graphic phenomenon has changed over time. One highly useful tool for automating the display of temporal observations is by using the ESRI TimeSlider Control.
Requirements
Target Platforms: Windows XP Professional, Windows Server 2003 family, Windows Vista, Windows Server 2008 family