November 2012
Esri 2012/2017 Demographic Data and Reports
The following reports have been updated and now include Census 2010 data and 2012/2017 Esri data:
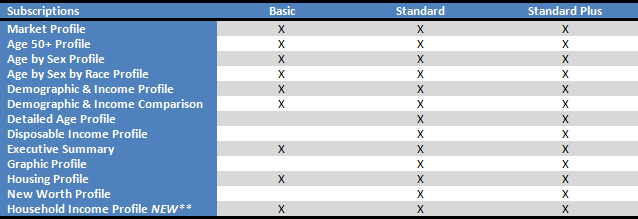 ** This report combines information formerly found in the Age by Income Profile and Detailed Income Profile.
The following reports are not available with the 2012/2017 Esri Updates:
- Age by Income Profile (content now available in new Household Income Profile)
- Detailed Income Profile (content now available in new Household Income Profile)
- Quarterly Demographic Profile